. 2010 Sep 24;329(5999):1656-60.
doi: 10.1126/science.1190544.

A general mechanism for network-dosage compensation in gene circuits

Affiliations

A general mechanism for network-dosage compensation in gene circuits

Murat Acar et al. Science. .

Abstract

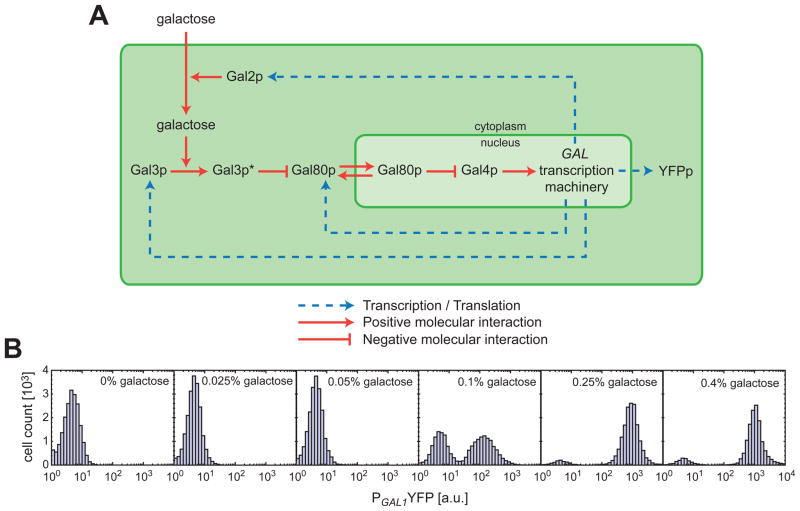
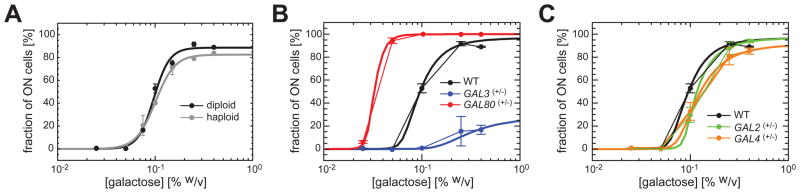
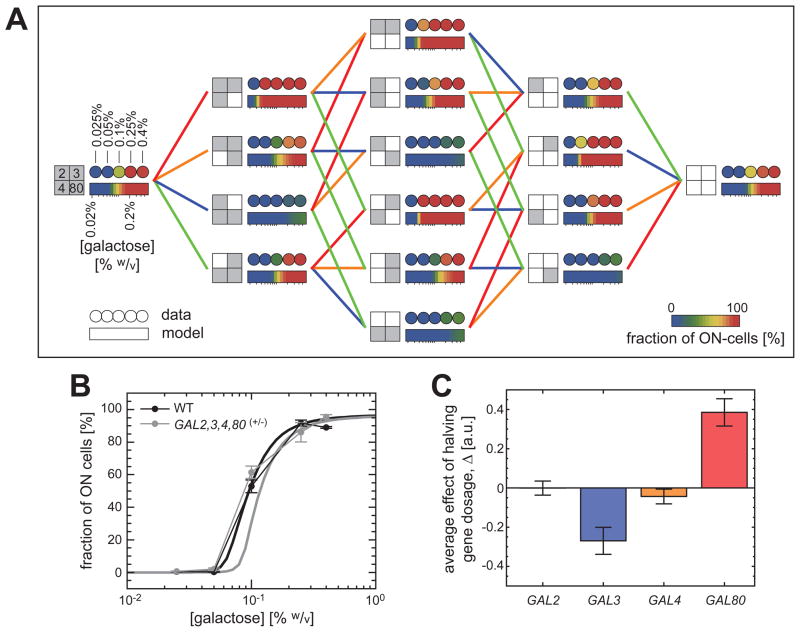
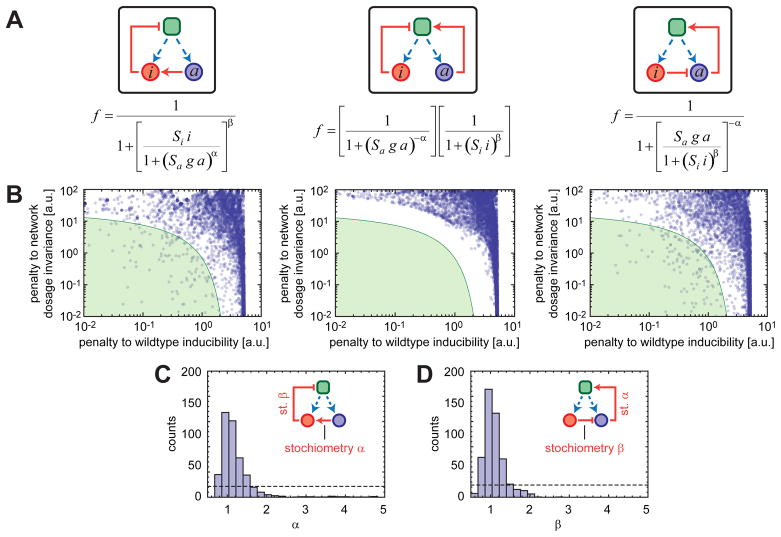
Coping with variations in network dosage is crucial for maintaining optimal function in gene networks. We explored how network structure facilitates network-level dosage compensation. By using the yeast galactose network as a model, we combinatorially deleted one of the two copies of its four regulatory genes and found that network activity was robust to the change in network dosage. A mathematical analysis revealed that a two-component genetic circuit with elements of opposite regulatory activity (activator and inhibitor) constitutes a minimal requirement for network-dosage invariance. Specific interaction topologies and a one-to-one interaction stoichiometry between the activating and inhibiting agents were additional essential elements facilitating dosage invariance. This mechanism of network-dosage invariance could represent a general design for gene network structure in cells.


Figures

Fig. 1
Fig. 1. The galactose utilization pathway as a model gene network and bistability as a quantitative phenotype
(A) Gal3p* represents the galactose-bound, active form of Gal3p. The shuttling of Gal80p between the cytoplasm and the nucleus is denoted by the bidirectional red arrows. The dotted blue arrows show how the transcriptional feedback loops are established through Gal2p, Gal3p, and Gal80p. (B) Histograms show the induction profile of the wild type galactose pathway for different galactose concentrations.
Fig. 2
Fig. 2. Haploid-diploid comparison and measurement of the contribution of each regulatory gene to network inducibility
(A) Fraction of ON cells as a function of galactose concentration for both diploid and haploid strains. The solid lines are guides to the eye constructed by fitting a sigmoidal function to the data. (B) The inducibility profile of the GAL network heterozygous in GAL3 (blue) or GAL80 (red) relative to the wild-type profile (black). (C) The inducibility profile of the GAL network heterozygous in GAL2 (green) or GAL4 (orange) relative to the wild-type profile (black). In both (B) and (C), the thick solid lines represent the model best fit to the 5 different inducibility profiles shown in Fig. 2B–C.
Fig. 3
Fig. 3. Systematic dosage variations and network-dosage compensation
(A) The color of each filled circle represents the network inducibility level. The rectangular, color-coded bars reflect the predictions of the model based on the best fit to the data presented in Fig. 2B–C. The genetic background of each strain is specified by a big square at its immediate left. The small squares represent the four regulatory genes of the GAL network. Grey (white) color marks the presence of two (one) copies of a specific gene. A line between two strains indicates that the two genetic backgrounds differ by a single copy of a specific gene and the color of the line codifies that gene (blue for GAL3, red for GAL80, green for GAL2, and orange for GAL4). (B) The similarity between the inducibility profiles of the wild-type strain (black) and the strain containing one copy of each regulatory gene (grey). The thick solid lines represent the model predictions. (C) Average contribution of the second copy of each regulatory gene to network inducibility (15).
Fig. 4
Fig. 4. Numerical analysis of general network features producing an inducible and network-dosage invariant system
(A) Each functional form represents the relationship between the fraction of transcriptionally active cells and the total concentrations of the activating (a) and inhibiting (i) agents. Blue and red circles represent activating and inhibiting agents, respectively. Dashed blue arrows denote the transcriptional production of the network components. The green square represents a transcriptional center. Pointing red arrows show direct activation while blunt red arrows represent inhibition. Each configuration is described by 4 parameters: the scales of action of the activator and inhibitor (Sa and Si respectively) and coefficients (α and β) quantifying the typical nonlinearity of the interaction with downstream components. (B) For each configuration depicted in (A), the degree of inducibility and network-dosage invariance of systems are plotted on the x and y axes, respectively. The green region corresponds to systems that are both inducible and network-dosage invariant. (C) For the left configuration in (A), histogram of the parameter values corresponding to the green region shown in (B). (D) As in (C) but for the right configuration shown in (A). In (C–D), the dotted lines show what one would expect had the parameters had no effect in determining whether the system was in the green region or not.

References

    1. Lee JA, Lupski JR. Genomic rearrangements and gene copy-number alterations as a cause of nervous system disorders. Neuron. 2006;52:103. - PubMed
    1. Galitski T, Saldanha AJ, Styles CA, Lander ES, Fink GR. Ploidy regulation of gene expression. Science. 1999;285:251. - PubMed
    1. Di Talia S, et al. Daughter-specific transcription factors regulate cell size control in budding yeast. PLoS Biol. 2009;7:e1000221. - PMC - PubMed
    1. Kellis M, Birren BW, Lander ES. Proof and evolutionary analysis of ancient genome duplication in the yeast Saccharomyces cerevisiae. Nature. 2004;428:617. - PubMed
    1. Rancati G, et al. Aneuploidy underlies rapid adaptive evolution of yeast cells deprived of a conserved cytokinesis motor. Cell. 2008;135:879. - PMC - PubMed

Publication types

MeSH terms

LinkOut - more resources