. 2010 Dec;207(3):355-65.
doi: 10.1677/JOE-10-0227. Epub 2010 Oct 7.

Role of PTH1R internalization in osteoblasts and bone mass using a phosphorylation-deficient knock-in mouse model

Affiliations

Role of PTH1R internalization in osteoblasts and bone mass using a phosphorylation-deficient knock-in mouse model

Nabanita S Datta et al. J Endocrinol. 2010 Dec.

Abstract

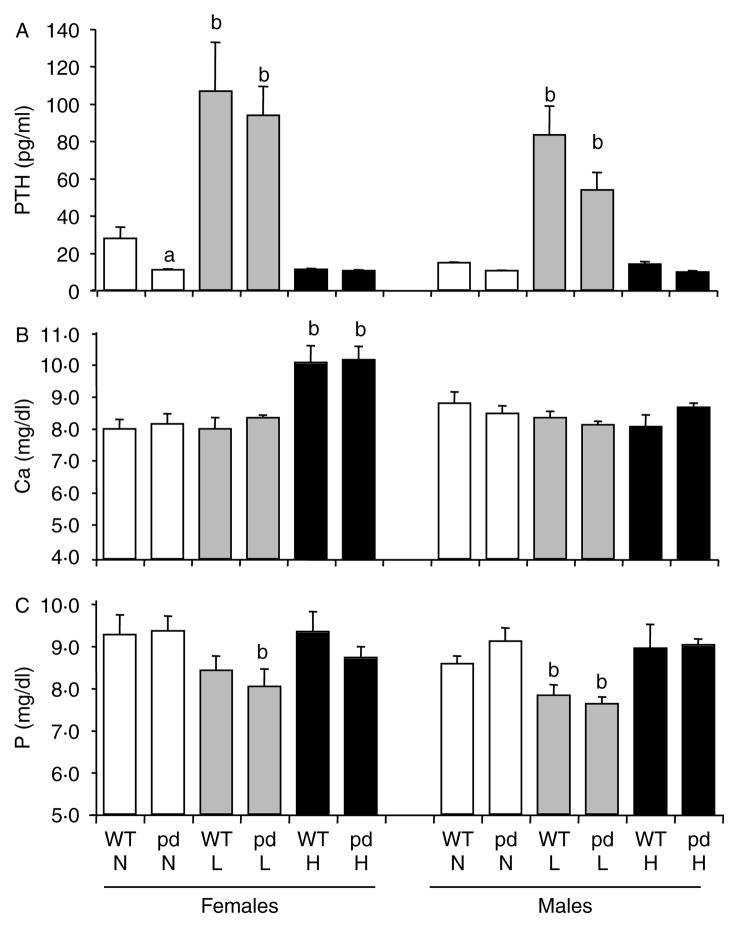
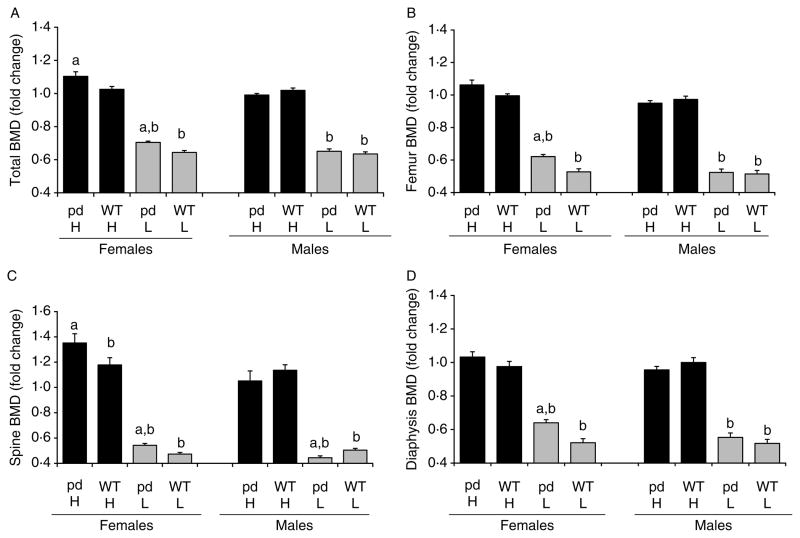
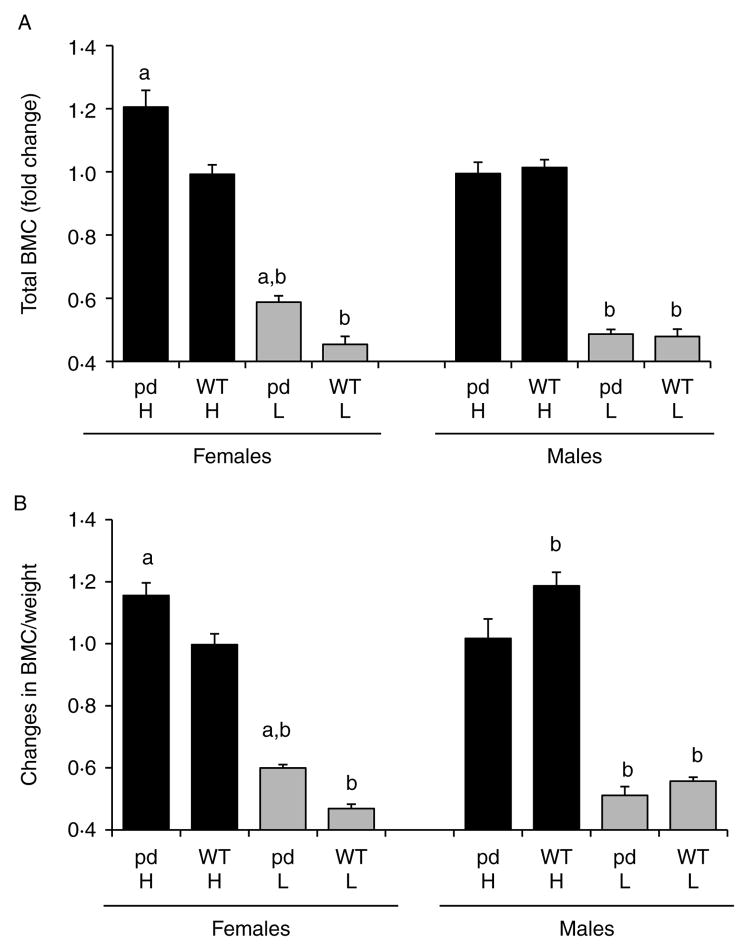
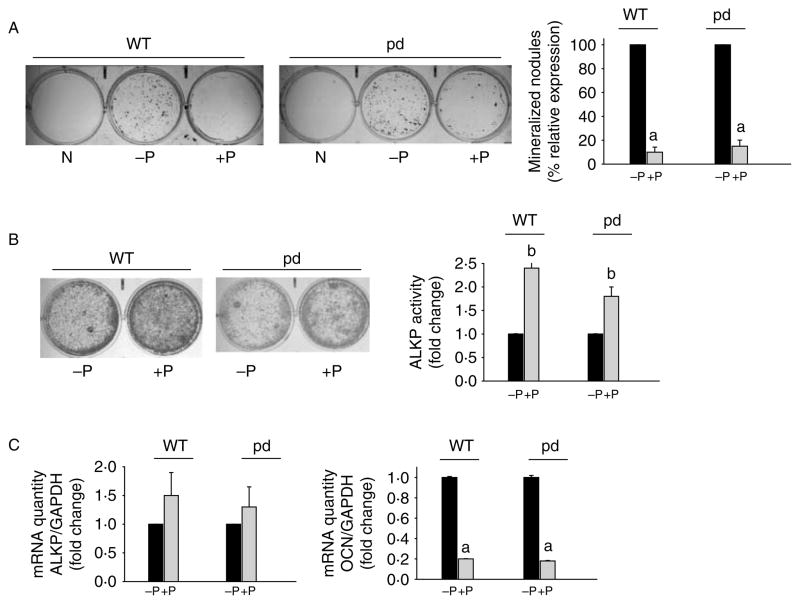
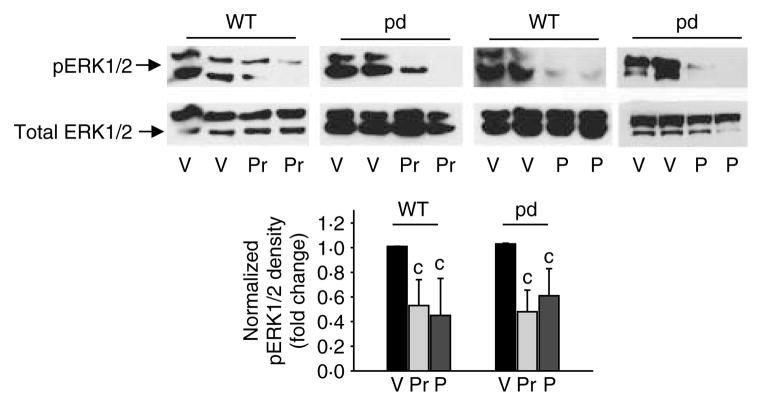
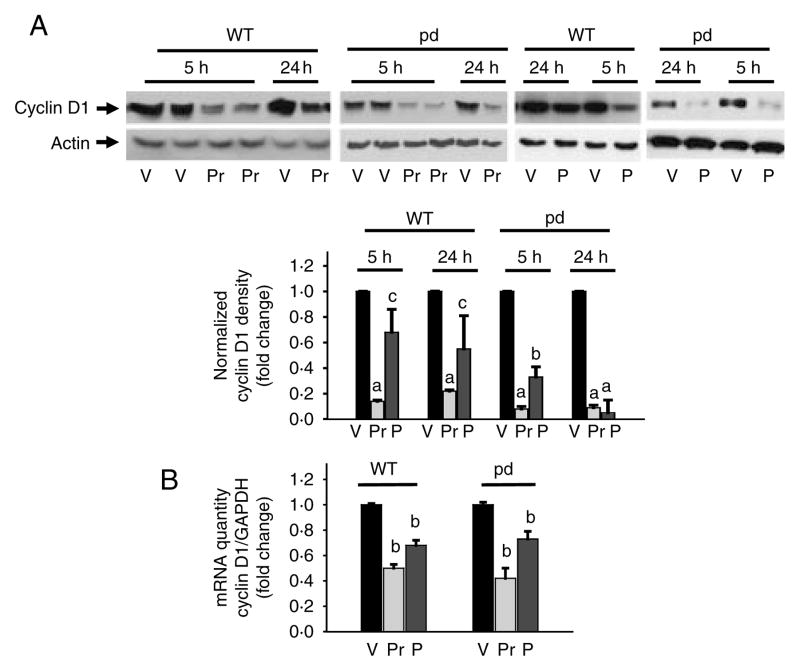
Phosphorylation, internalization, and desensitization of G protein-coupled receptors, such as the parathyroid hormone (PTH) and PTH-related peptide (PTHrP) receptor (PTH1R), are well characterized and known to regulate the cellular responsiveness in vitro. However, the role of PTH1R receptor phosphorylation in bone formation and osteoblast functions has not yet been elucidated. In previous studies, we demonstrated impaired internalization and sustained cAMP stimulation of a phosphorylation-deficient (pd) PTH1R in vitro, and exaggerated cAMP and calcemic responses to s.c. PTH infusion in pdPTH1R knock-in mouse model. In this study, we examined the impact of impaired PTH1R phosphorylation on the skeletal phenotype of mice maintained on normal, low, and high calcium diets. The low calcium diet moderately reduced (P<0.05) bone volume and trabecular number, and increased trabecular spacing in both wild-type (WT) and pd mice. The effects, however, seem to be less pronounced in the female pd compared to WT mice. In primary calvarial osteoblasts isolated from 2-week-old pd or WT mice, PTH and PTHrP decreased phosphorylated extracellular signal-regulated kinases 1/2 (pERK1/2), a member of mitogen-activated protein kinase, and cyclin D1, a G₁/S phase cyclin, in vitro. In contrast to WT osteoblasts, down-regulation of cyclin D1 was sustained for longer periods of time in osteoblasts isolated from the pd mice. Our results suggest that adaptive responses of intracellular signaling pathways in the pd mice may be important for maintaining bone homeostasis.


Conflict of interest statement

Declaration of interest The authors declare that there is no conflict of interest that could be perceived as prejudicing the impartiality of the research reported.

Figures

Figure 1
Figure 1
Effect of dietary calcium on serum PTH, total calcium, and phosphate levels of the WT and the pd mice. Four-week-old wild-type and pd littermate mice were fed with the normal (0.6%), high (2%), and low (0.02%) calcium diets for 4 weeks, and retro-orbital venous blood samples were collected at the end of week 4 of a special diet. (A) PTH, (B) total calcium, and (C) phosphate were measured by ELISA. Data are means±S.D. (n=6 from each group). a, P<0.05 pd versus WT; b, P<0.05 low or high calcium diet versus normal diet. H, high calcium diet; L, low calcium diet; N, normal calcium diet. pd, phosphorylation-deficient PTH1R; WT, wild-type.
Figure 2
Figure 2
Effect of dietary calcium on bone mineral density (BMD) of the WT and the pd mice. Four-week-old WT and pd littermate mice were fed with the normal (0.6%), high (2%), and low (0.02%) calcium diets for 4 weeks. At the end of week 4 of a special diet (8 weeks of age), bone parameters were measured by either PIXImus or micro-CT. Data on the low and high calcium diets were normalized by dividing each BMD value to its corresponding normal diet value, and the fold changes relative to a normal diet are plotted. A value of 1.0 equals the corresponding BMD value on a normal diet. Data are means±S.D. (n=6 from each group). a, P<0.05 pd versus WT; b, P<0.05 special calcium diet versus normal diet. H, high calcium diet; L, low calcium diet; pd, phosphorylation-deficient PTH1R; WT, wild-type. BMD values of normal diet are for (A), female pd mice, 0.0408±0.0014; female WT mice, 0.0429±0.0012; male pd mice, 0.04484±0.0026; male WT mice, 0.04476±0.0016; for (B), female pd mice, 0.05649±0.0022; female WT mice, 0.06019±0.0019; male pd mice, 0.06711±0.0079; male WT mice, 0.06583±0.0053; for (C), female pd mice, 0.04859±0.0033; female WT mice, 0.05463±0.005; male pd mice, 0.05407 ±0.0051; male WT mice, 0.05087±0.0039; for (D), female pd mice, 0.05164±0.0028; female WT mice, 0.05444±0.0027; male pd mice, 0.06199±0.0095; male WT mice, 0.06169±0.0072; for (E), female pd mice, 0.297±0.0238; female WT mice, 0.346±0.0309; male pd mice, 0.35857±0.04; male WT mice, 0.34843±0.0283; for (F), female pd mice, 0.01489±0.0016; female WT mice, 0.01847 ±0.0015; male pd mice, 0.01363±0.0011, male WT mice, 0.01301±0.001.
Figure 3
Figure 3
Effect of dietary calcium on bone mineral content (BMC) of the WT and the pd mice. Four-week-old WT and pd littermate mice were fed with the normal (0.6%), high (2%), and low (0.02%) calcium diets for 4 weeks. At the end of week 4 of a special diet (8 weeks of age), bone parameters were measured by either PIXImus or micro-CT. Data on the low and high calcium diets were normalized by dividing each BMC value to its corresponding normal diet value, and the fold changes relative to a normal diet are plotted. A value of 1.0 equals the corresponding BMC value on a normal diet. Data are means±S.D. (n=6 from each group). a, P<0.05 pd versus WT; b, P<0.05 special calcium diet versus normal diet. H, high calcium diet; L, low calcium diet; pd, phosphorylation-deficient PTH1R; WT, wild-type. BMC values of a normal diet are for (A), female pd mice, 0.297±0.0238; female WT mice, 0.346±0.0309; male pd mice, 0.35857±0.04; male WT mice, 0.34843±0.0283; for (B), female pd mice, 0.01489±0.0016; female WT mice, 0.01847±0.0015; male pd mice, 0.01363±0.0011; male WT mice 0.01301±0.001.
Figure 4
Figure 4
Effect of PTH on differentiation of primary calvarial osteoblasts isolated from the WT and the pd mice. (A) Representative von Kossa staining of primary calvarial osteoblasts isolated from the WT and the pd mice. The cells were differentiated with ascorbic acid and β-glycerophosphate for 19 days with or without 100 nM PTH. Following von Kossa staining, mineralized bone nodules of phosphate deposits were counted. The results are expressed as percent relative expression of bone nodules without PTH treatment. Results from representative culture plates are shown. (B) Primary calvarial osteoblasts isolated from the WT and the pd mice were differentiated for 5 days as above, with and without PTH. Results from representative ALKP staining of 5 day differentiated cultures are shown. ALKP activity was measured in duplicate plates, and the results are expressed as fold change with respect to untreated cells. (C) Real-time PCR analysis was performed to analyze RNA extracted from differentiated WT and pd calvarial osteoblasts with and without PTH treatment. GAPDH was used as an internal control. Results are expressed as mean±S.D. from five to six independent experiments. a, P<0.001. P, PTH; pd, phosphorylation-deficient PTH1R; WT, wild-type; N, undifferentiated control.
Figure 5
Figure 5
Expression of pERK1/2 in differentiated primary calvarial osteoblasts isolated from the WT and the pd mice. Differentiated calvarial osteoblasts were treated with 100 nM PTHrP (Pr), PTH (P), or vehicle (V) for 10 min. Total cellular protein was harvested. Western blot analyses were performed for total ERK1/2 and phosphorylated ERK1/2. Densitometric analyses were performed, normalized to total ERK1/2, and plotted. Representative data from at least three to four independent experiments are shown. Data are expressed as mean±S.D. c, P<0.05 versus V. pd, phosphorylation-deficient PTH1R; WT, wild-type.
Figure 6
Figure 6
Expression of cyclin D1 in differentiated primary calvarial osteoblasts isolated from the WT and the pd mice. Differentiated calvarial osteoblasts were treated with 100 nM PTHrP (Pr), PTH (P), or vehicle (V) for either 5–24 h (A) or 1 h (B). Total cellular protein or RNA was harvested. (A) Western blot analyses were performed for cyclin D1 and actin (loading control). Densitometric values were normalized and plotted. (B) Real-time PCR analysis was performed for cyclin D1 mRNA, normalized with GAPDH, and plotted. Representative data from at least three to four independent experiments are shown. Data are expressed as mean±S.D. a, P<0.001 versus V; b, P<0.01 versus V; c, P<0.05 versus V. pd, phosphorylation-deficient PTH1R; WT, wild-type.

References

    1. Abou-Samra AB, Jueppner H, Potts JT, Jr, Segre GV. Inactivation of pertussis toxin-sensitive guanyl nucleotide-binding proteins increase parathyroid hormone receptors and reverse agonist-induced receptor down-regulation in ROS 17/2.8 cells. Endocrinology. 1989;125:2594–2599. doi: 10.1210/endo-125-5-2594. - DOI - PubMed
    1. Bellorin-Font E, Lopez C, Diaz K, Pernalete N, Lopez M, Starosta R. Role of protein kinase C on the acute desensitization of renal cortical adenylate cyclase to parathyroid hormone. Kidney International. 1995;47:38–44. doi: 10.1038/ki.1995.4. - DOI - PubMed
    1. Bounoutas GS, Tawfeek H, Frohlich LF, Chung UI, Abou-Samra AB. Impact of impaired receptor internalization on calcium homeostasis in knock-in mice expressing a phosphorylation-deficient parathyroid hormone (PTH)/PTH-related peptide receptor. Endocrinology. 2006;147:4674–4679. doi: 10.1210/en.2006-0301. - DOI - PubMed
    1. Chao WI, Forte LR. Rat kidney cells in primary culture: hormone-mediated desensitization of the adenosine 3′,5′-monophosphate response to parathyroid hormone and calcitonin. Endocrinology. 1982;111:252–259. doi: 10.1210/endo-111-1-252. - DOI - PubMed
    1. Chen C, Koh AJ, Datta NS, Zhang J, Keller ET, Xiao G, Franceschi RT, D'Silva NJ, McCauley LK. Impact of the mitogen-activated protein kinase pathway on parathyroid hormone-related protein actions in osteoblasts. Journal of Biological Chemistry. 2004;279:29121–29129. doi: 10.1074/jbc.M313000200. - DOI - PubMed

Publication types

Substances