Clinical Trial
. 2011 Feb;6(2):412-22.
doi: 10.2215/CJN.04950610. Epub 2010 Oct 7.

Autologous mesenchymal stromal cells and kidney transplantation: a pilot study of safety and clinical feasibility

Affiliations
Clinical Trial

Autologous mesenchymal stromal cells and kidney transplantation: a pilot study of safety and clinical feasibility

Norberto Perico et al. Clin J Am Soc Nephrol. 2011 Feb.

Abstract

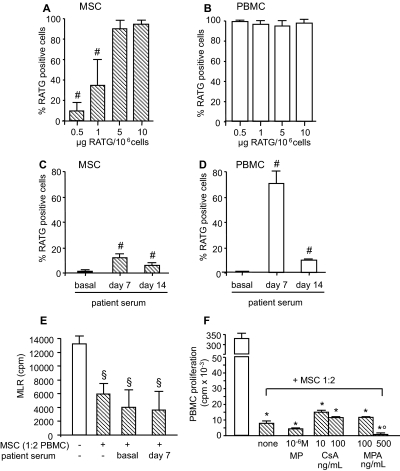
Background and objectives: Mesenchymal stromal cells (MSCs) abrogate alloimmune response in vitro, suggesting a novel cell-based approach in transplantation. Moving this concept toward clinical application in organ transplantation should be critically assessed.

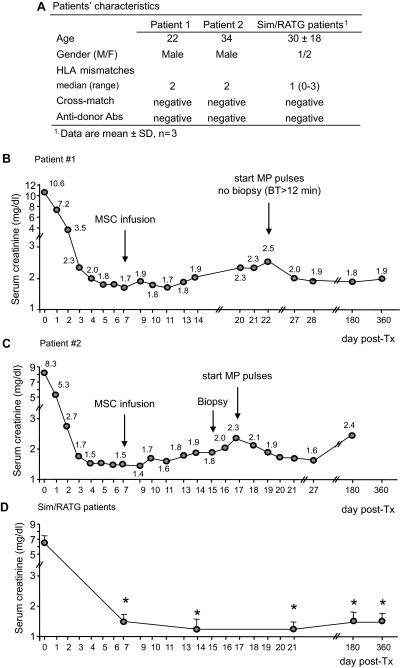
Design, setting, participants & measurements: A safety and clinical feasibility study (ClinicalTrials.gov, NCT00752479) of autologous MSC infusion was conducted in two recipients of kidneys from living-related donors. Patients were given T cell-depleting induction therapy and maintenance immunosuppression with cyclosporine and mycophenolate mofetil. On day 7 posttransplant, MSCs were administered intravenously. Clinical and immunomonitoring of MSC-treated patients was performed up to day 360 postsurgery.

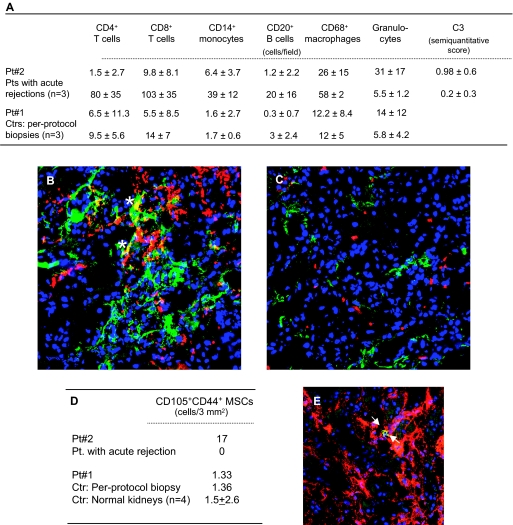
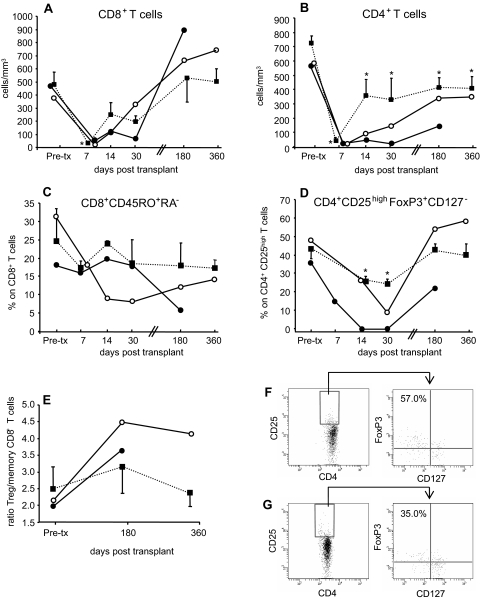
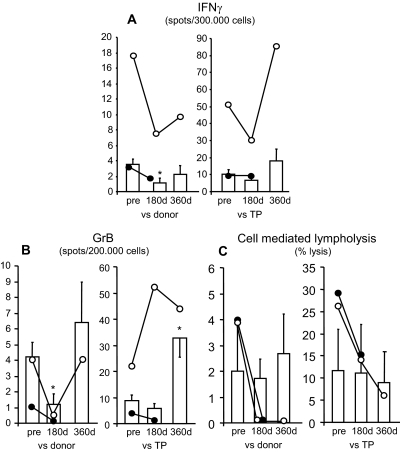
Results: Serum creatinine levels increased 7 to 14 days after cell infusion in both MSC-treated patients. A graft biopsy in patient 2 excluded acute graft rejection, but showed a focal inflammatory infiltrate, mostly granulocytes. In patient 1 protocol biopsy at 1-year posttransplant showed a normal graft. Both MSC-treated patients are in good health with stable graft function. A progressive increase of the percentage of CD4+CD25highFoxP3+CD127- Treg and a marked inhibition of memory CD45RO+RA-CD8+ T cell expansion were observed posttransplant. Patient T cells showed a profound reduction of CD8+ T cell activity.

Conclusions: Findings from this study in the two patients show that MSC infusion in kidney transplant recipients is feasible, allows enlargement of Treg in the peripheral blood, and controls memory CD8+ T cell function. Future clinical trials with MSCs to look with the greatest care for unwanted side effects is advised.


Figures

Figure 1.
Figure 1.
Characteristics and posttransplant course of serum creatinine in patients given MSCs and in control patients: Patients' characteristics (A) and profile of serum creatinine levels before and after MSC infusion in patient 1 (B) and patient 2 (C) and profile of serum creatinine in Sim/RATG patients (D) during the first year after kidney transplantation are shown. Sim/RATG patients are control living donor-kidney transplant recipients given the same induction therapy but not MSCs. Data are means ± SEM; *P < 0.05 versus time 0.
Figure 2.
Figure 2.
In vitro pretransplant studies: 200,000 MSCs (A) or 200,000 PBMCs (B) were incubated for 30 minutes at 37°C with graded doses of RATG, washed, and then incubated with FITC-labeled goat anti-rabbit IgG secondary antibody. Percentages of RATG-positive cells were determined by FACS analysis after subtraction of nonspecific binding of secondary antibody to cells in the absence of RATG. Data are means ± SD; #P < 0.05 versus 5 and 10 μg of RATG per 106 cells (by ANOVA, n = 4 independent experiments). MSCs (C) or PBMCs (D) were also incubated with serum from patients given Sim/RATG taken pretransplant (n = 3), 7 days posttransplant (n = 3), and 14 days posttransplant (n = 3). Cells were then labeled with secondary antibody and analyzed as above. Data are means ± SD; #P < 0.05 versus basal. In (E), MLRs were conducted in the absence or in the presence of either untreated MSCs or MSCs pre-exposed to patients' serum taken at basal (n = 3) or 7 days posttransplant (n = 3). Data are means ± SD; §P < 0.05 versus −/− (by ANOVA, n = 3 independent experiments). In (F), PBMCs (100,000 per well) were also incubated with anti-CD3/CD28 conjugated beads for 3 days in the absence (white bars) or in the presence (dashed bars) of MSCs (1:2 MSCs:PBMCs). Cultures with MSCs were conducted in the absence (none) or with the indicated concentration of MP, CsA, and MPA. The percentage inhibition of anti-CD3/CD28–induced PBMC proliferation with various drug concentrations ranged from 10% to 30% for MP or CsA alone and from 60% to 87% for MPA alone. Data are means ± SD; *P < 0.05 versus allogeneic MLR, °P < 0.05 versus none (by ANOVA, n = 3 independent experiments).
Figure 3.
Figure 3.
Characterization of infiltrating cells, complement deposition, and MSCs in kidney grafts. Kidney graft biopsies were taken at day 15 posttransplant in patient 2 because of the suspicion of graft rejection and at day 360 in patient 1 (protocol biopsy). As controls, renal biopsies from patients with acute graft rejection (n = 3) within 15 to 100 days postoperative and from patients (n = 3) undergoing protocol biopsy at 1 year posttransplant were analyzed. (A) reports counts of intragraft cell infiltrates and score of C3 complement deposition. For both immunofluorescence and immunoperoxidase analyses the number of positive cells were counted in at least 20 to 30 high-power fields. Complement deposition, analyzed by immunofluorescence technique, was scored for intensity (absent, faint, moderate, intense: 0 to 3) in at least 20 to 30 high-power fields. Data for patients 1 and 2 are the mean ± SD of cell counts in the 20 to 30 high-power fields. (B) and (C) are representative images of intragraft immunostaining for granulocytes (red) and C3 deposition (green) in patient 2 given MSCs and in a patient with acute graft rejection, respectively. In patient 2 granulocytes colocalized with C3 staining (*). Original magnification, ×400. (D) reports intragraft CD105 and CD44 double-positive cell counts in kidney graft biopsies from patients 2 and 1. As controls, renal biopsies from a patient with acute graft rejection at day 15 postoperative, a patient undergoing protocol biopsy at 1 year posttransplant, and a section of normal renal tissue from patients undergoing nephrectomy for renal carcinoma were analyzed. The total number of double-positive cells counted in 3 mm2 (corresponding to the area of about 30 high-power fields) is reported. (E) is a representative image of intragraft double-positive MSCs for CD105 and CD44 (arrows) in patient 2. Original magnification, ×400.
Figure 4.
Figure 4.
Kinetics of repopulating T cells in peripheral blood: (A) and (B) show the kinetics of absolute numbers of repopulating CD8+ and CD4+ T cells, respectively, in the peripheral blood of patient 1 (○) and patient 2 (●) and Sim/RATG patients (living donor-kidney transplant recipients given the same induction therapy but not MSCs, as controls, ■) from baseline (pretransplant) to day 360 posttransplant. Data are means ± SEM. *P < 0.05 versus pretransplant. Percentages of memory CD45RO+RA T cells within CD8+ T cells (C) and of regulatory CD25highFoxP3+CD127 cells within CD4+ T cells [Treg, (D)] and the ratio of Treg/memory CD8+ T cells (E) from patient 1 (○) and patient 2 (●) and from Sim/RATG patients (■) from baseline (pretransplant) to day 360 posttransplant. Data are means ± SEM. *P < 0.05 versus pretransplant. Expression of FoxP3 and CD127 antigens (dot plots on the right) by gated CD4+ and CD25high T cells (dot plots on the left) at day 360 posttransplant from patient 1 (F) and from a living donor-kidney transplant recipient given the same induction therapy but not MSCs (G) is shown. Numbers in outlined areas indicate percentage of FoxP3+CD127 T cells.
Figure 5.
Figure 5.
Immunological assays of the memory T cell response were evaluated by ELISPOT for IFN-γ (A) and Granzyme-B (B) and the CD8+ T cell function by T cell–mediated lympholysis [percentage-specific lysis at 50:1 effector-target ratio, (C)] toward donor and third-party (TP) antigens on PBMCs taken pretransplant (“pre”) and at day 180 and day 360 posttransplant from patient 1 (○) and day 180 from patient 2 (●), and from Sim/RATG patients (living donor-kidney transplant recipients given the same induction therapy but not MSCs, as controls, white bars). Data are means ± SEM. *P < 0.05 versus pretransplant.

References

    1. Sayegh MH, Carpenter CB: Transplantation 50 years later–progress, challenges, and promises. N Engl J Med 351: 2761–2766, 2004 - PubMed
    1. Sayegh MH, Remuzzi G: Clinical update: Immunosuppression minimisation. Lancet 369: 1676–1678, 2007 - PubMed
    1. Millan MT, Shizuru JA, Hoffmann P, Dejbakhsh-Jones S, Scandling JD, Grumet FC, Tan JC, Salvatierra O, Hoppe RT, Strober S: Mixed chimerism and immunosuppressive drug withdrawal after HLA-mismatched kidney and hematopoietic progenitor transplantation. Transplantation 73: 1386–1391, 2002 - PubMed
    1. Shapiro R, BasGray E, Kahn A, Randhawa P, Basu A, Tan H, Murase N, Zeevi A, Girnita A, Metes D, Ness R, Bass DC, Demetris AJ, Fung JJ, Marcos A, Starzl TE: Kidney transplantation under minimal immunosuppression after pretransplant lymphoid depletion with Thymoglobulin or Campath. J Am Coll Surg 200: 505–515, quiz A559–A561, 2005 - PMC - PubMed
    1. Kirk AD, Mannon RB, Kleiner DE, Swanson JS, Kampen RL, Cendales LK, Elster EA, Wakefield T, Chamberlain C, Hoffmann SC, Hale DA: Results from a human renal allograft tolerance trial evaluating T-cell depletion with alemtuzumab combined with deoxyspergualin. Transplantation 80: 1051–1059, 2005 - PubMed

Publication types

MeSH terms

Associated data