

Age and axillary lymph node ratio in postmenopausal women with T1-T2 node positive breast cancer
- PMID: 20930094
- PMCID: PMC3227897
- DOI: 10.1634/theoncologist.2010-0044
Age and axillary lymph node ratio in postmenopausal women with T1-T2 node positive breast cancer
Abstract
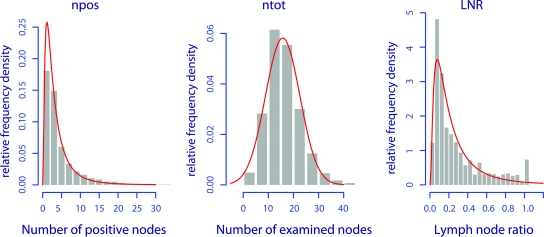
Purpose: The purpose of this article was to examine the relationship between age and lymph node ratio (LNR, number of positive nodes divided by number of examined nodes), and to determine their effects on breast cancer (BC) and overall mortality.
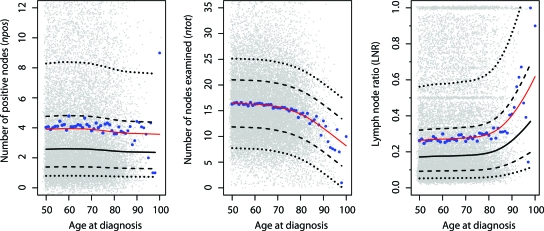
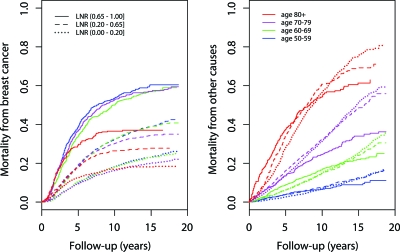
Methods: Women aged ≥50 years, diagnosed in 1988-1997 with a unilateral histologically confirmed T1-T2 node positive surgically treated primary nonmetastatic BC, were selected from the National Cancer Institute's Surveillance, Epidemiology, and End Results (SEER). Generalized Additive Models for Location Scale and Shape (GAMLSS) were used to evaluate the age-LNR relationship. Cumulative incidence functions and multivariate competing risks analysis based on model selection by the Bayesian Information Criterion (BIC) were used to examine the effect of age and LNR on mortality. Low LNR was defined as ≤0.20, mid-LNR 0.21-0.65, and high LNR >0.65.
Results: GAMLSS showed a nonlinear LNR-age relationship, increasing from mean LNR 0.26-0.28 at age 50-70 years to 0.30 at 80 years and 0.40 at 90 years. Compared with a 9.8% [95% confidence interval (CI) 8.8%-10.8%] risk of BC death at 5 years in women aged 50-59 years with low LNR, the risk in women ≥80 years with low LNR was 12.6% [95% CI 10.1%-15.0%], mid-LNR 18.1% [13.9%-22.1%], high LNR 29.8% [22.7%-36.1%]. Five-years overall risk of death increased from 40.8% [37.5%-43.9%] by low LNR to 67.4% [61.4%-72.4%] by high LNR. The overall mortality hazard ratio for age ≥80 years with high LNR was 7.49 [6.54-8.59], as compared with women aged 50-59 years with low LNR.
Conclusion: High LNR combined with older age was associated with a threefold increased risk of BC death and a sevenfold increased hazard ratio of overall mortality.
Conflict of interest statement
Section Editor
Section Editor
Reviewer “A” discloses no financial relationships.
Reviewer “B” discloses no financial relationships.
Reviewer “C” discloses no financial relationships.
The content of this article has been reviewed by independent peer reviewers to ensure that it is balanced, objective, and free from commercial bias. On the basis of disclosed information, all conflicts of interest have been resolved.
Figures
Similar articles
-
Axillary lymph node ratio and total number of removed lymph nodes: predictors of survival in stage I and II breast cancer.Eur J Surg Oncol. 2002 Aug;28(5):481-9. doi: 10.1053/ejso.2002.1239. Eur J Surg Oncol. 2002. PMID: 12217299
-
Additional prognostic value of lymph node ratio over pN staging in different breast cancer subtypes based on the results of 1,656 patients.Arch Gynecol Obstet. 2015 May;291(5):1153-66. doi: 10.1007/s00404-014-3528-6. Epub 2014 Nov 5. Arch Gynecol Obstet. 2015. PMID: 25367604
-
Lymph node counts and ratio in axillary dissections following neoadjuvant chemotherapy for breast cancer: a better alternative to traditional pN staging.Ann Surg Oncol. 2014 Jan;21(1):42-50. doi: 10.1245/s10434-013-3245-6. Epub 2013 Sep 7. Ann Surg Oncol. 2014. PMID: 24013900
-
Ratio and log odds of positive lymph nodes in breast cancer patients with mastectomy.Surg Oncol. 2015 Sep;24(3):239-47. doi: 10.1016/j.suronc.2015.05.001. Epub 2015 May 19. Surg Oncol. 2015. PMID: 26055316 Review.
-
Breast cancer patients with a negative axillary ultrasound may have clinically significant nodal metastasis.Breast Cancer Res Treat. 2021 Jun;187(2):303-310. doi: 10.1007/s10549-021-06194-8. Epub 2021 Apr 10. Breast Cancer Res Treat. 2021. PMID: 33837870 Review.
Cited by
-
Lymph node ratio (LNR) as a complementary staging system to TNM staging in salivary gland cancer.Eur Arch Otorhinolaryngol. 2019 Dec;276(12):3425-3434. doi: 10.1007/s00405-019-05597-0. Epub 2019 Sep 11. Eur Arch Otorhinolaryngol. 2019. PMID: 31511971 Free PMC article.
-
Potential prognostic value of the lymph node ratio and its correlation with circulating sex hormone concentration in pathological T1/2 breast cancer patients: a retrospective study.Ann Transl Med. 2022 May;10(10):585. doi: 10.21037/atm-22-2039. Ann Transl Med. 2022. PMID: 35722397 Free PMC article.
-
Prognostic value of the metastatic lymph node ratio in patients with pancreatic cancer.Int J Clin Exp Pathol. 2019 Dec 1;12(12):4329-4337. eCollection 2019. Int J Clin Exp Pathol. 2019. PMID: 31933834 Free PMC article.
-
Impact of age on the cancer-specific survival of patients with localized renal cell carcinoma: martingale residual and competing risks analysis.PLoS One. 2012;7(10):e48489. doi: 10.1371/journal.pone.0048489. Epub 2012 Oct 30. PLoS One. 2012. PMID: 23119034 Free PMC article.
-
Recursive partitioning analysis of lymph node ratio in breast cancer patients.Medicine (Baltimore). 2015 Jan;94(1):e208. doi: 10.1097/MD.0000000000000208. Medicine (Baltimore). 2015. PMID: 25569639 Free PMC article.
References
-
- Boivin-Angele S, Hall J, Sasco AJ, et al. Breast Cancer. Lyon, France: IARC Press; 2003. [Accessed January 23, 2010]. pp. 188–193. Available at http://www.iarc.fr.
-
- Héry C, Ferlay J, Boniol M, et al. Changes in breast cancer incidence and mortality in middle-aged and elderly women in 28 countries with Caucasian majority populations. Ann Oncol. 2008;19:1009–1018. - PubMed
-
- Peto R, Boreham J, Clarke M, et al. UK and USA breast cancer deaths down 25% in year 2000 at ages 20–69 years. Lancet. 2000;355(9217):1822. - PubMed
-
- Jatoi I, Chen BE, Anderson WF, et al. Breast cancer mortality trends in the United States according to estrogen receptor status and age at diagnosis. J Clin Oncol. 2007;25:1683–1690. - PubMed
MeSH terms
LinkOut - more resources
Full Text Sources
Medical
