

Signaling by olfactory receptor neurons near threshold
- PMID: 20930117
- PMCID: PMC2972989
- DOI: 10.1073/pnas.1004571107
Signaling by olfactory receptor neurons near threshold
Abstract
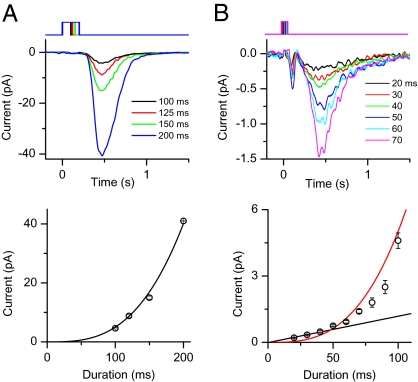
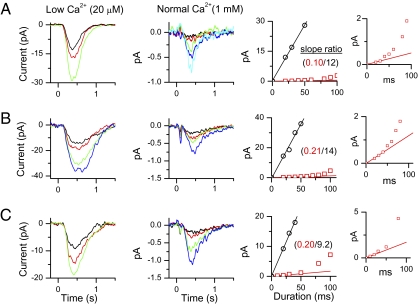
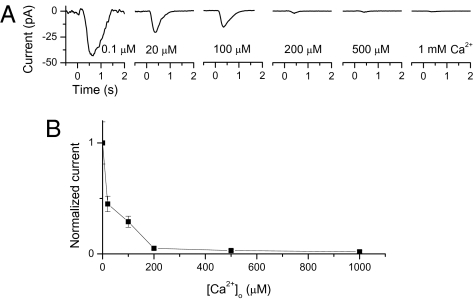
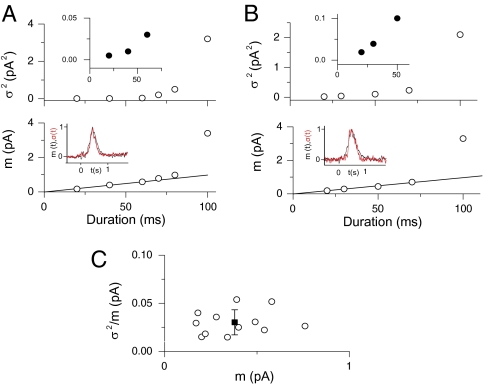
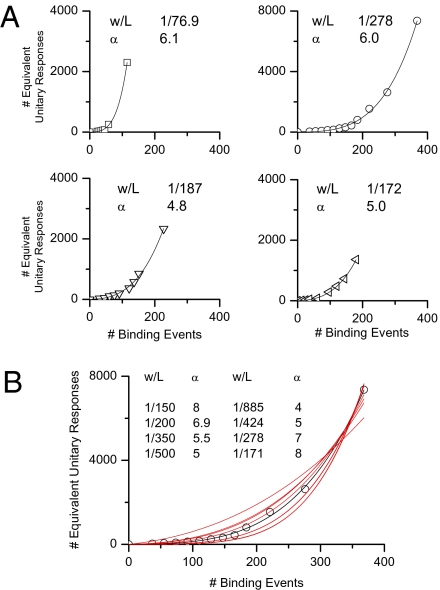
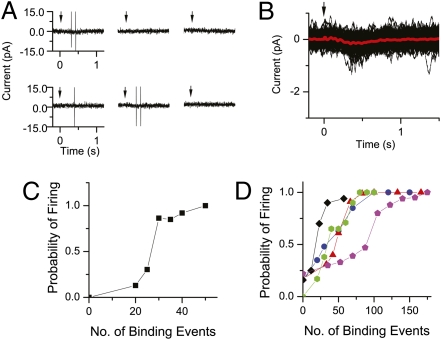
An important contributing factor for the high sensitivity of sensory systems is the exquisite sensitivity of the sensory receptor cells. We report here the signaling threshold of the olfactory receptor neuron (ORN). We first obtained a best estimate of the size of the physiological electrical response successfully triggered by a single odorant-binding event on a frog ORN, which was ∼0.034 pA and had an associated transduction domain spanning only a tiny fraction of the length of an ORN cilium. We also estimated the receptor-current threshold for an ORN to fire action potentials in response to an odorant pulse, which was ∼1.2 pA. Thus, it takes about 35 odorant-binding events successfully triggering transduction during a brief odorant pulse in order for an ORN to signal to the brain.
Conflict of interest statement
The authors declare no conflict of interest.
Figures
Similar articles
-
Temporal structure of receptor neuron input to the olfactory bulb imaged in behaving rats.J Neurophysiol. 2009 Feb;101(2):1073-88. doi: 10.1152/jn.90902.2008. Epub 2008 Dec 17. J Neurophysiol. 2009. PMID: 19091924 Free PMC article.
-
Correspondence between odorant-evoked patterns of receptor neuron input and intrinsic optical signals in the mouse olfactory bulb.J Neurophysiol. 2003 Mar;89(3):1623-39. doi: 10.1152/jn.00747.2002. Epub 2002 Oct 23. J Neurophysiol. 2003. PMID: 12612023
-
Adaptive integrate-and-fire model reproduces the dynamics of olfactory receptor neuron responses in a moth.J R Soc Interface. 2019 Aug 30;16(157):20190246. doi: 10.1098/rsif.2019.0246. Epub 2019 Aug 7. J R Soc Interface. 2019. PMID: 31387478 Free PMC article.
-
Odor recognition and second messenger signaling in olfactory receptor neurons.Semin Cell Biol. 1994 Feb;5(1):25-32. doi: 10.1006/scel.1994.1004. Semin Cell Biol. 1994. PMID: 8186393 Review.
-
The cyclic AMP signaling pathway in the rodent main olfactory system.Cell Tissue Res. 2021 Jan;383(1):429-443. doi: 10.1007/s00441-020-03391-7. Epub 2021 Jan 15. Cell Tissue Res. 2021. PMID: 33447881 Review.
Cited by
-
Implications for human odor sensing revealed from the statistics of odorant-receptor interactions.PLoS Comput Biol. 2018 May 21;14(5):e1006175. doi: 10.1371/journal.pcbi.1006175. eCollection 2018 May. PLoS Comput Biol. 2018. PMID: 29782484 Free PMC article.
-
Smelling better with chloride.Proc Natl Acad Sci U S A. 2016 Oct 4;113(40):11063-11065. doi: 10.1073/pnas.1614328113. Epub 2016 Sep 22. Proc Natl Acad Sci U S A. 2016. PMID: 27660238 Free PMC article. No abstract available.
-
Interplay among cGMP, cAMP, and Ca2+ in living olfactory sensory neurons in vitro and in vivo.J Neurosci. 2011 Jun 8;31(23):8395-405. doi: 10.1523/JNEUROSCI.6722-10.2011. J Neurosci. 2011. PMID: 21653844 Free PMC article.
-
Antagonism in olfactory receptor neurons and its implications for the perception of odor mixtures.Elife. 2018 Apr 24;7:e34958. doi: 10.7554/eLife.34958. Elife. 2018. PMID: 29687778 Free PMC article.
-
Mechanics regulates ATP-stimulated collective calcium response in fibroblast cells.J R Soc Interface. 2015 Jul 6;12(108):20150140. doi: 10.1098/rsif.2015.0140. J R Soc Interface. 2015. PMID: 26063818 Free PMC article.
References
-
- Schild D, Restrepo D. Transduction mechanisms in vertebrate olfactory receptor cells. Physiol Rev. 1998;78:429–466. - PubMed
-
- Matthews HR, Reisert J. Calcium, the two-faced messenger of olfactory transduction and adaptation. Curr Opin Neurobiol. 2003;13:469–475. - PubMed
-
- Munger SD, Leinders-Zufall T, Zufall F. Subsystem organization of the mammalian sense of smell. Annu Rev Physiol. 2009;71:115–140. - PubMed
Publication types
MeSH terms
Grants and funding
LinkOut - more resources
Full Text Sources
Other Literature Sources
