Vertical distribution of specific ventilation in normal supine humans measured by oxygen-enhanced proton MRI
- PMID: 20930129
- PMCID: PMC3006418
- DOI: 10.1152/japplphysiol.00220.2010
Vertical distribution of specific ventilation in normal supine humans measured by oxygen-enhanced proton MRI
Abstract
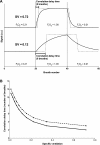
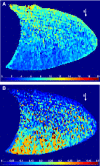
Specific ventilation (SV) is the ratio of fresh gas entering a lung region divided by its end-expiratory volume. To quantify the vertical (gravitationally dependent) gradient of SV in eight healthy supine subjects, we implemented a novel proton magnetic resonance imaging (MRI) method. Oxygen is used as a contrast agent, which in solution changes the longitudinal relaxation time (T1) in lung tissue. Thus alterations in the MR signal resulting from the regional rise in O(2) concentration following a sudden change in inspired O(2) reflect SV-lung units with higher SV reach a new equilibrium faster than those with lower SV. We acquired T1-weighted inversion recovery images of a sagittal slice of the supine right lung with a 1.5-T MRI system. Images were voluntarily respiratory gated at functional residual capacity; 20 images were acquired with the subject breathing air and 20 breathing 100% O(2), and this cycle was repeated five times. Expired tidal volume was measured simultaneously. The SV maps presented an average spatial fractal dimension of 1.13 ± 0.03. There was a vertical gradient in SV of 0.029 ± 0.012 cm(-1), with SV being highest in the dependent lung. Dividing the lung vertically into thirds showed a statistically significant difference in SV, with SV of 0.42 ± 0.14 (mean ± SD), 0.29 ± 0.10, and 0.24 ± 0.08 in the dependent, intermediate, and nondependent regions, respectively (all differences, P < 0.05). This vertical gradient in SV is consistent with the known gravitationally induced deformation of the lung resulting in greater lung expansion in the dependent lung with inspiration. This SV imaging technique can be used to quantify regional SV in the lung with proton MRI.
Figures


Similar articles
-
Quantitative Mapping of Specific Ventilation in the Human Lung using Proton Magnetic Resonance Imaging and Oxygen as a Contrast Agent.J Vis Exp. 2019 Jun 5;(148):10.3791/59579. doi: 10.3791/59579. J Vis Exp. 2019. PMID: 31233033 Free PMC article.
-
Validating the distribution of specific ventilation in healthy humans measured using proton MR imaging.J Appl Physiol (1985). 2014 Apr 15;116(8):1048-56. doi: 10.1152/japplphysiol.00982.2013. Epub 2014 Feb 6. J Appl Physiol (1985). 2014. PMID: 24505099 Free PMC article.
-
The gravitational distribution of ventilation-perfusion ratio is more uniform in prone than supine posture in the normal human lung.J Appl Physiol (1985). 2013 Aug 1;115(3):313-24. doi: 10.1152/japplphysiol.01531.2012. Epub 2013 Apr 25. J Appl Physiol (1985). 2013. PMID: 23620488 Free PMC article.
-
[T1 maps and O2-enhanced MRT of the diseased lung. Emphysema, fibrosis, mucoviscidosis].Radiologe. 2006 Apr;46(4):282, 284-9. doi: 10.1007/s00117-006-1346-y. Radiologe. 2006. PMID: 16482462 Review. German.
-
Advances in functional and structural imaging of the human lung using proton MRI.NMR Biomed. 2014 Dec;27(12):1542-56. doi: 10.1002/nbm.3156. Epub 2014 Jul 2. NMR Biomed. 2014. PMID: 24990096 Free PMC article. Review.
Cited by
-
Quantitative Mapping of Specific Ventilation in the Human Lung using Proton Magnetic Resonance Imaging and Oxygen as a Contrast Agent.J Vis Exp. 2019 Jun 5;(148):10.3791/59579. doi: 10.3791/59579. J Vis Exp. 2019. PMID: 31233033 Free PMC article.
-
Susceptibility to high-altitude pulmonary edema is associated with a more uniform distribution of regional specific ventilation.J Appl Physiol (1985). 2017 Apr 1;122(4):844-852. doi: 10.1152/japplphysiol.00494.2016. Epub 2017 Jan 5. J Appl Physiol (1985). 2017. PMID: 28057815 Free PMC article.
-
Lung functional imaging.Breathe (Sheff). 2023 Sep;19(3):220272. doi: 10.1183/20734735.0272-2022. Epub 2023 Nov 14. Breathe (Sheff). 2023. PMID: 38020338 Free PMC article.
-
Phase-Resolved Functional Lung MRI Evaluation of Dynamic Hyperinflation Induced by Metronome-Paced Tachypnea in Patients with Chronic Obstructive Pulmonary Disease.COPD. 2025 Dec;22(1):2502671. doi: 10.1080/15412555.2025.2502671. Epub 2025 Jun 13. COPD. 2025. PMID: 40512448
-
Imaging for lung physiology: what do we wish we could measure?J Appl Physiol (1985). 2012 Jul;113(2):317-27. doi: 10.1152/japplphysiol.00146.2012. Epub 2012 May 10. J Appl Physiol (1985). 2012. PMID: 22582217 Free PMC article. Review.
References
-
- Albert MS, Cates GD, Driehuys B, Happer W, Saam B, Springer CSJ, Wishnia A. Biological magnetic resonance imaging using laser-polarized 129Xe. Nature 370: 199–201, 1994 - PubMed
-
- Amis TC, Jones HA, Hughes JM. Effect of posture on inter-regional distribution of pulmonary ventilation in man. Respir Physiol 56: 145–167, 1984 - PubMed
-
- Chen Q, Jakob PM, Griswold MA, Levin DL, Hatabu H, Edelman RR. Oxygen enhanced MR ventilation imaging of the lung. MAGMA 7: 153–161, 1998 - PubMed
-
- Davidson MR. Further considerations in a theoretical description of gas-transport in lung airways. Bull Math Biol 43: 517–548, 1981 - PubMed
-
- Edelman RR, Hatabu H, Tadamura E, Li W, Prasad PV. Noninvasive assessment of regional ventilation in the human lung using oxygen-enhanced magnetic resonance imaging. Nat Med 2: 1236–1239, 1996 - PubMed
Publication types
MeSH terms
Substances
Grants and funding
LinkOut - more resources
Full Text Sources
Other Literature Sources
Medical

