

n-3 Fatty acids decrease arterial low-density lipoprotein cholesterol delivery and lipoprotein lipase levels in insulin-resistant mice
- PMID: 20930167
- PMCID: PMC3107680
- DOI: 10.1161/ATVBAHA.110.215848
n-3 Fatty acids decrease arterial low-density lipoprotein cholesterol delivery and lipoprotein lipase levels in insulin-resistant mice
Abstract
Objective: To determine whether n-3 fatty acids (n-3) influence arterial cholesterol delivery and lipoprotein lipase (LpL) levels in insulin-resistant mice.
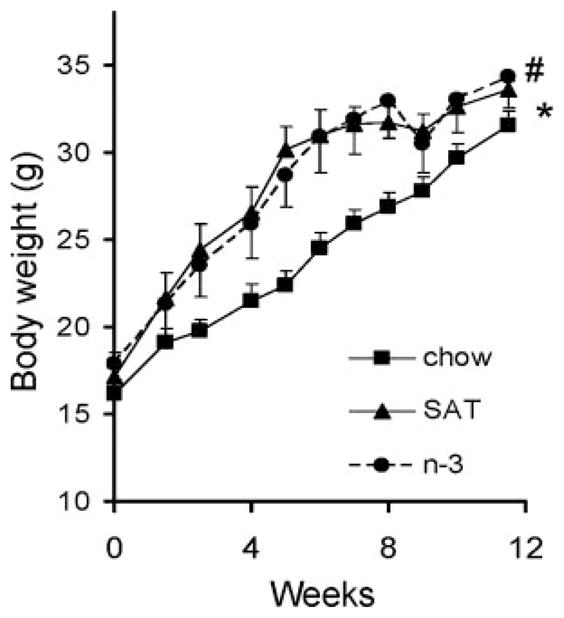
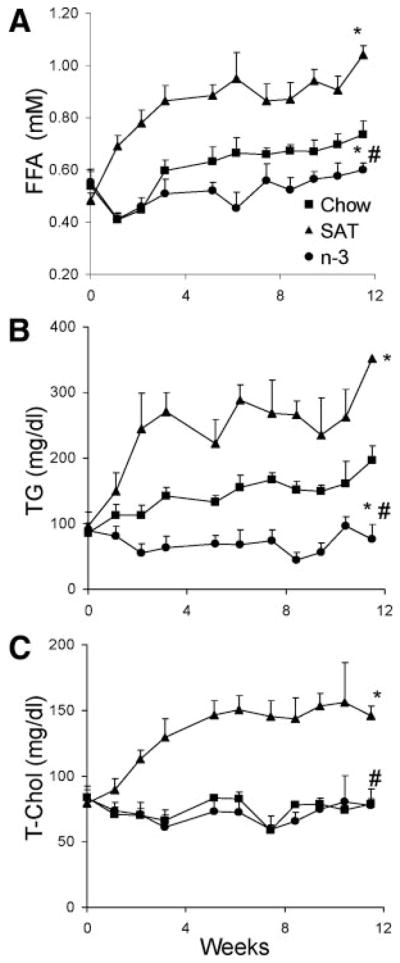
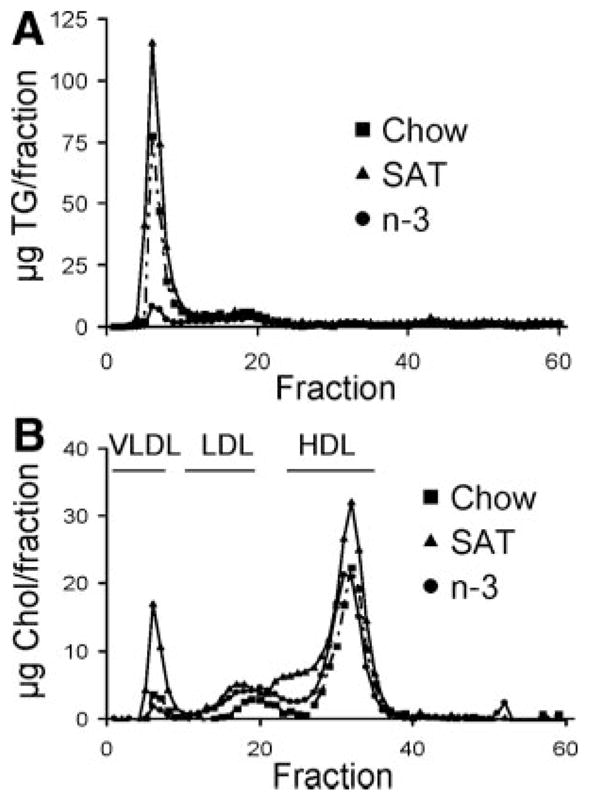
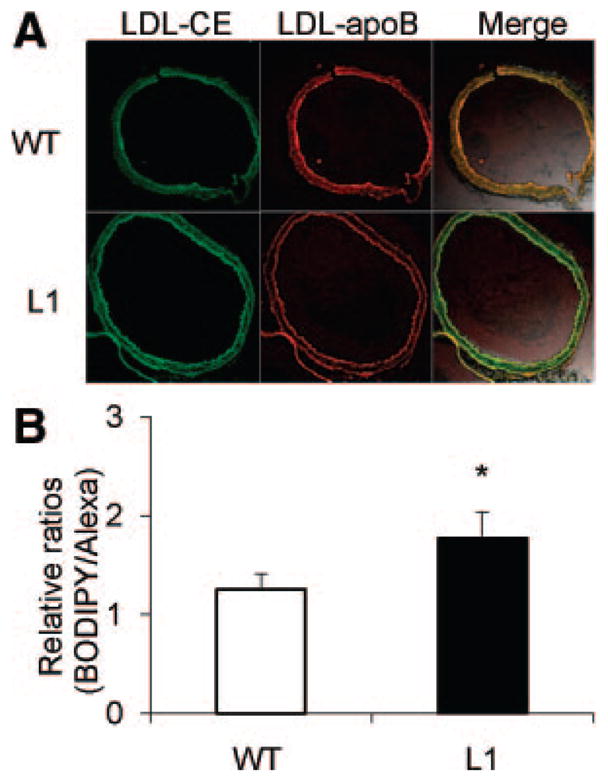
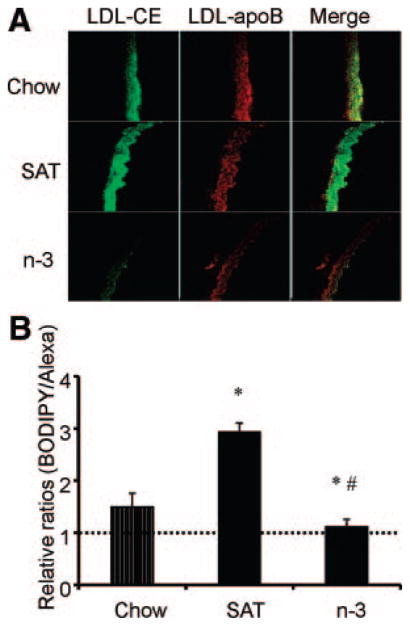
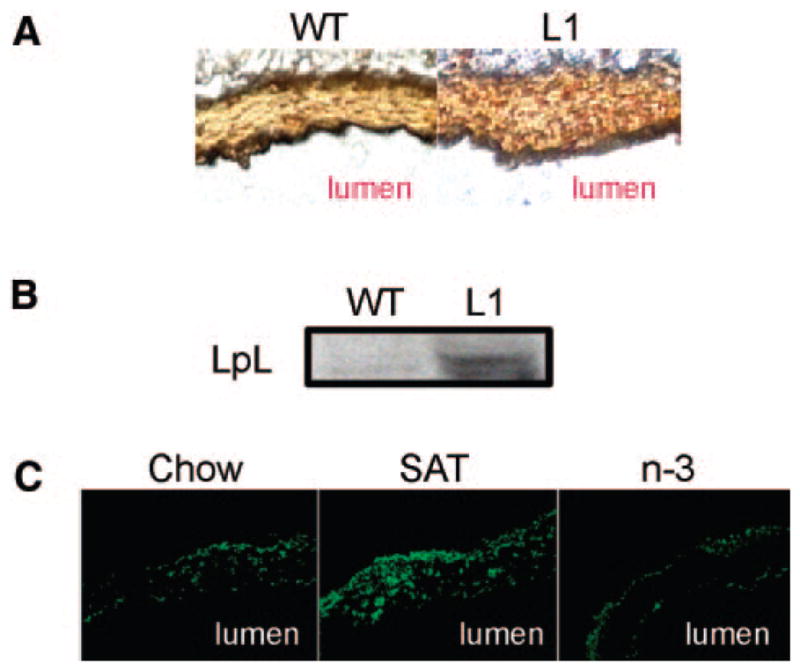
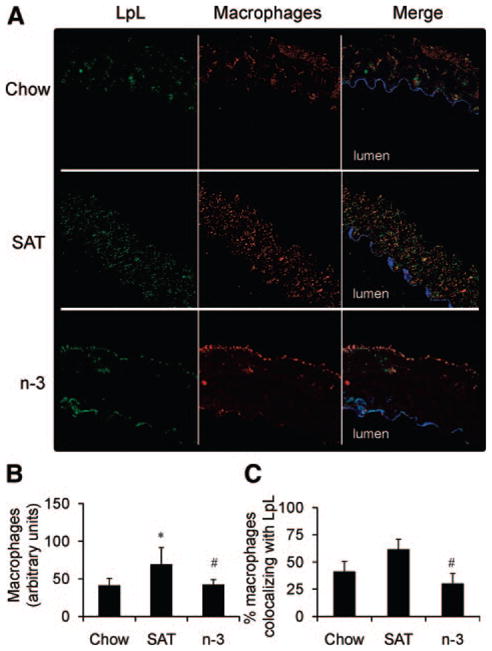
Methods and results: Insulin resistance contributes to risk of cardiovascular disease. It was previously reported that saturated fat (SAT) diets increased, but n-3 diets decreased, arterial low-density lipoprotein (LDL) cholesterol deposition from LDL total and selective uptake; this was associated with increased or decreased arterial LpL, respectively. Insulin receptor transgenic knockout mice (L1) were fed a chow, SAT, or n-3 diet for 12 weeks. Double-fluorescent boron dipyrromethene (BODIPY)-cholesteryl ester (CE) and Alexa dye-labeled human LDL were injected to separately trace LDL-CE and LDL-apolipoprotein B whole particle uptake. In contrast to SAT, n-3 diets markedly reduced all plasma lipids, ameliorating progression of insulin resistance. As opposed to SAT, n-3 reduced arterial LDL uptake, CE deposition, and selective uptake. Disparate patterns of CE deposition between diets were comparable with arterial LpL distribution; SAT induced high LpL levels throughout aortic media; LpL was limited only to intima in n-3-fed mice.
Conclusions: n-3 diets diminish arterial LDL-cholesterol deposition in mice with insulin resistance, and this is associated with changes in arterial LpL levels and distribution.
Figures
Similar articles
-
Incremental replacement of saturated fats by n-3 fatty acids in high-fat, high-cholesterol diets reduces elevated plasma lipid levels and arterial lipoprotein lipase, macrophages and atherosclerosis in LDLR-/- mice.Atherosclerosis. 2014 Jun;234(2):401-9. doi: 10.1016/j.atherosclerosis.2014.03.022. Epub 2014 Apr 3. Atherosclerosis. 2014. PMID: 24747115 Free PMC article.
-
n-3 fatty acids reduce arterial LDL-cholesterol delivery and arterial lipoprotein lipase levels and lipase distribution.Arterioscler Thromb Vasc Biol. 2009 Apr;29(4):555-61. doi: 10.1161/ATVBAHA.108.182287. Epub 2009 Feb 5. Arterioscler Thromb Vasc Biol. 2009. PMID: 19201689 Free PMC article.
-
Saturated fat-rich diet enhances selective uptake of LDL cholesteryl esters in the arterial wall.J Clin Invest. 2005 Aug;115(8):2214-22. doi: 10.1172/JCI24327. Epub 2005 Jul 21. J Clin Invest. 2005. PMID: 16041409 Free PMC article.
-
Omega-3 fatty acids ameliorate atherosclerosis by favorably altering monocyte subsets and limiting monocyte recruitment to aortic lesions.Arterioscler Thromb Vasc Biol. 2012 Sep;32(9):2122-30. doi: 10.1161/ATVBAHA.112.253435. Epub 2012 Jul 19. Arterioscler Thromb Vasc Biol. 2012. PMID: 22814747 Free PMC article.
-
N-3 vs. saturated fatty acids: effects on the arterial wall.Prostaglandins Leukot Essent Fatty Acids. 2010 Apr-Jun;82(4-6):205-9. doi: 10.1016/j.plefa.2010.02.020. Epub 2010 Mar 6. Prostaglandins Leukot Essent Fatty Acids. 2010. PMID: 20207121 Free PMC article. Review.
Cited by
-
Lipoprotein lipase: new roles for an 'old' enzyme.Curr Opin Clin Nutr Metab Care. 2019 Mar;22(2):111-115. doi: 10.1097/MCO.0000000000000536. Curr Opin Clin Nutr Metab Care. 2019. PMID: 30648986 Free PMC article. Review.
-
Lipoprotein Lipase Deficiency Impairs Bone Marrow Myelopoiesis and Reduces Circulating Monocyte Levels.Arterioscler Thromb Vasc Biol. 2018 Mar;38(3):509-519. doi: 10.1161/ATVBAHA.117.310607. Epub 2018 Jan 25. Arterioscler Thromb Vasc Biol. 2018. PMID: 29371243 Free PMC article.
-
Incremental replacement of saturated fats by n-3 fatty acids in high-fat, high-cholesterol diets reduces elevated plasma lipid levels and arterial lipoprotein lipase, macrophages and atherosclerosis in LDLR-/- mice.Atherosclerosis. 2014 Jun;234(2):401-9. doi: 10.1016/j.atherosclerosis.2014.03.022. Epub 2014 Apr 3. Atherosclerosis. 2014. PMID: 24747115 Free PMC article.
-
Inflammation in depression: is adiposity a cause?Dialogues Clin Neurosci. 2011;13(1):41-53. doi: 10.31887/DCNS.2011.13.1/rshelton. Dialogues Clin Neurosci. 2011. PMID: 21485745 Free PMC article.
-
Adipose-specific lipoprotein lipase deficiency more profoundly affects brown than white fat biology.J Biol Chem. 2013 May 17;288(20):14046-14058. doi: 10.1074/jbc.M113.469270. Epub 2013 Mar 31. J Biol Chem. 2013. PMID: 23542081 Free PMC article.
References
-
- Haffner SM, Lehto S, Ronnemaa T, Pyorala K, Laakso M. Mortality from coronary heart disease in subjects with type 2 diabetes and in nondiabetic subjects with and without prior myocardial infarction. N Engl J Med. 1998;339:229–234. - PubMed
-
- Nigro J, Osman N, Dart AM, Little PJ. Insulin resistance and atherosclerosis. Endocr Rev. 2006;27:242–259. - PubMed
-
- de Vries R, Borggreve SE, Dullaart RP. Role of lipases, lecithin:cholesterol acyltransferase and cholesteryl ester transfer protein in abnormal high density lipoprotein metabolism in insulin resistance and type 2 diabetes mellitus. Clin Lab. 2003;49:601–613. - PubMed
-
- Sartippour MR, Renier G. Upregulation of macrophage lipoprotein lipase in patients with type 2 diabetes: role of peripheral factors. Diabetes. 2000;49:597–602. - PubMed
Publication types
MeSH terms
Substances
Grants and funding
LinkOut - more resources
Full Text Sources
Other Literature Sources
Medical
Molecular Biology Databases
Research Materials
Miscellaneous
