. 2010 Sep 15;9(18):3740-50.
doi: 10.4161/cc.9.18.12936. Epub 2010 Sep 8.

Therapeutic targeting of C-terminal binding protein in human cancer

Affiliations

Therapeutic targeting of C-terminal binding protein in human cancer

Michael W Straza et al. Cell Cycle. .

Abstract

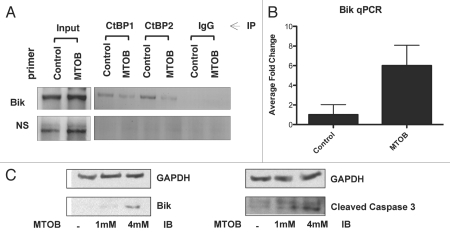
The CtBP transcriptional corepressors promote cancer cell survival and migration/invasion. CtBP senses cellular metabolism via a regulatory dehydrogenase domain, and is antagonized by p14/p19(ARF) tumor suppressors. The CtBP dehydrogenase substrate 4-methylthio-2-oxobutyric acid (MTOB) can act as a CtBP inhibitor at high concentrations, and is cytotoxic to cancer cells. MTOB induced apoptosis was p53-independent, correlated with the derepression of the proapoptotic CtBP repression target Bik, and was rescued by CtBP overexpression or Bik silencing. MTOB did not induce apoptosis in mouse embryonic fibroblasts (MEFs), but was increasingly cytotoxic to immortalized and transformed MEFs, suggesting that CtBP inhibition may provide a suitable therapeutic index for cancer therapy. In human colon cancer cell peritoneal xenografts, MTOB treatment decreased tumor burden and induced tumor cell apoptosis. To verify the potential utility of CtBP as a therapeutic target in human cancer, the expression of CtBP and its negative regulator ARF was studied in a series of resected human colon adenocarcinomas. CtBP and ARF levels were inversely-correlated, with elevated CtBP levels (compared with adjacent normal tissue) observed in greater than 60% of specimens, with ARF absent in nearly all specimens exhibiting elevated CtBP levels. Targeting CtBP may represent a useful therapeutic strategy in human malignancies.


Figures

Figure 1
Figure 1
The CtBP substrate MTOB is cytotoxic to colon cancer cell lines. (A) The colon adenocarcinoma cell lines HCT116 wild type (+/+) or p53-null (−/−), were treated for 72 hours with MTOB or normal media (Control). Cell viability was determined by MTT assay and normalized to the untreated samples. The average of three separate experiments is shown, and error bars equal the standard error of the mean (SEM). (B) HCT116−/− cells were plated at low density and treated with normal media or media containing the indicated amount of MTOB for 72 hours, and then replaced with compoundfree media for four days. Colony formation was assessed by GIEMSA staining, and all wells were normalized to the untreated control. Experiments were done three times in duplicate, with a representative plate shown. Error bars represent the SEM. (C) HCT116−/− and +/+ cells were treated with the indicated concentrations of cisplatin in the presence or absence of 4 mM MTOB for 48 hours, and cell viability assessed by MTT assay. Error bars represent the SEM.
Figure 2
Figure 2
MTOB modulates CtBP transcriptional functions. (A) MTOB displaces CtBP2 from the Bik promoter. HCT116−/− cells were treated for 18 hours with 4 mM MTOB or NaCl (control), and CtBP2 and CtBP1 association with the Bik promoter assessed by ChIP using control IgG, anti-CtBP 1 or 2 antibodies and formaldehyde crosslinked chromatin. DNA retained in the ChIPs was analyzed by PCR using either Bik promoter primers that amplify a fragment containing BKLF sites (Bik) or a fragment of DNA located 10 kb upstream of the Bik transcription start site (NS). (B) MTOB increases expression of Bik mRNA. Quantitative real-time PCR using RNA prepared from HCT116 p53−/−cells treated with NaCl (control) or 10 mM MTOB. Error bars are equal to the SEM. (C) MTOB regulates Bik expression. HCT116 p53−/− cells were treated with control media (−) or media containing 1 mM or 4 mM MTOB. Bik, cleaved caspase 3, and GAPDH levels were determined by immunoblotting of cell lysates prepared 24 hr after treatment.
Figure 3
Figure 3
MTOB-induced cell death is dependent on inhibition of CtBP-mediated repression of Bik. (A) HCT116−/− cells were transfected with CtBP2-V5 or empty pCDNA3 vector, and transfected cells were enriched by G418 selection for one week to form pooled cell lines. Once selected, cells were plated and treated for 72 hours with either 4 mM MTOB or normal media (control). Cell viability was then determined by trypan blue assay. Experiments were performed in triplicate and error bars indicate the SEM. (B) Cell lysates were immunoblotted to detect expression of CtBP2, CtBP2-V5 and Bik in the presence (+) and absence (−) of 4 mM MTOB. (C) HCT116−/− cells stably expressing one of two shRNAs targeting Bik or GFP under the control of the Tet-repressor were plated in the presence of doxycycline for 24 hours before being treated with normal media or 4 mM MTOB. After 72 hours, cells were harvested and cell viability determined by trypan blue assay. Error bars represent the SEM. (D) Cell lysates were immunoblotted to detect expression of Bik in the presence of shGFP or one of two hairpins targeting Bik, shBik1 and shBik2. Bik levels were quantified by densitometry, and normalized for GAPDH.
Figure 4
Figure 4
MTOB effectively and safely targets cancer cells in vivo. (A) Primary wild-type mouse embryonic fibroblasts (MEFs), immortalized ARF−/− MEFs, and ARF−/− MEFs stably transfected with mutant Ras and c-Myc vectors were treated for 3 days with 4 mM MTOB or normal media (control), followed by four days in normal media. Cell survival of MEF colonies was determined by A595 of solubilized Giemsa-stained cells expressed relative to the untreated cells. Experiments were performed 3 times in duplicate, and error bars represent the SEM. (B) Tumor-free survival (TFS) of Nu/Nu mice inoculated with HCT116−/− cells and treated one week later with PBS or 750 mg/kg MTOB three times a week for 7 weeks, unless mice were euthanized sooner due to progressive tumor growth. p = 0.08 for comparison of median TFS between PBS and MTOB treatment. (C) Tumor burden was assessed by measuring total peritoneal tumor weight at time of death or sacrifice (left), and by measuring the volume of ascites before necropsy (right). Treatment groups were compared by unpaired t-test with tumor weight and ascites both significantly less in the MTOB group (p = 0.007 and 0.04, respectively). Error bars indicate SEM. (D) Sections of paraffin-embedded tumor were analyzed for apoptosis by TUNEL staining. 5 high power fields were counted for 7 tumors each from PBS- or MTOB-treated animals, and the averages plotted (top). Differences between the two groups were analyzed for statistical significance by Mann-Whitney test, with p = 0.0001. A representative section of PBS and MTOB treated tumors are shown at 400x magnification. (E) Tumor weights for MTOB- and PBS-treated tumors were plotted against days of survival, analyzed by linear regression, and the slopes compared by ANCOVA, with a p value of 0.0009.
Figure 5
Figure 5
CtBP and p14ARF levels are inversely-correlated in human colorectal adenocarcinomas. (A) Samples from colorectal adenocarcinoma specimens were analyzed by immunoblot for levels of p14ARF, CtBP1/2 and GAPDH. Tumors were separated into three groups based on the CtBP levels in tumor vs. normal tissue. Representative blots from the three groups are shown. (B) RNA was isolated from the same tumors and RT-PCR performed to determine CtBP2 and GAPDH mRNA levels in tumor vs. normal tissue. (C) Summary of the three classes of colorectal tumors based on CtBP and ARF expression levels. The inverse correlation of ARF and CtBP1/2 expression was significant by exact Fischer's test with p = 0.0001 for Class I vs. Class II, p = 0.06 for Class II vs. Class III, but not siginificant for the comparison of Class I vs. Class III (p = 0.12).

Comment in

  • Incapacitating CtBP to kill cancer.
    Zhao LZ, Chinnadurai G. Zhao LZ, et al. Cell Cycle. 2010 Sep 15;9(18):3645-6. doi: 10.4161/cc.9.18.13221. Epub 2010 Sep 15. Cell Cycle. 2010. PMID: 20930508 Free PMC article. No abstract available.

References

    1. Subramanian T, Chinnadurai G. Association of class I histone deacetylases with transcriptional corepressor CtBP. FEBS Lett. 2003;540:255–258. - PubMed
    1. Chinnadurai G. CtBP family proteins: more than transcriptional corepressors. Bioessays. 2003;25:9–12. - PubMed
    1. Boyd JM, Subramanian T, Schaeper U, La Regina M, Bayley S, Chinnadurai G. A region in the C-terminus of adenovirus 2/5 E1a protein is required for association with a cellular phosphoprotein and important for the negative modulation of T24-ras mediated transformation, tumorigenesis and metastasis. EMBO J. 1993;12:469–478. - PMC - PubMed
    1. Schaeper U, Boyd JM, Verma S, Uhlmann E, Subramanian T, Chinnadurai G. Molecular cloning and characterization of a cellular phosphoprotein that interacts with a conserved C-terminal domain of adenovirus E1A involved in negative modulation of oncogenic transformation. Proc Natl Acad Sci USA. 1995;92:10467–10471. - PMC - PubMed
    1. Bergman LM, Blaydes JP. C-terminal binding proteins: emerging roles in cell survival and tumorigenesis. Apoptosis. 2006;11:879–888. - PubMed

Publication types

MeSH terms