. 2010 Oct 8:11:501.
doi: 10.1186/1471-2105-11-501.

Predicting enzyme targets for cancer drugs by profiling human metabolic reactions in NCI-60 cell lines

Affiliations

Predicting enzyme targets for cancer drugs by profiling human metabolic reactions in NCI-60 cell lines

Limin Li et al. BMC Bioinformatics. .

Abstract

Background: Drugs can influence the whole metabolic system by targeting enzymes which catalyze metabolic reactions. The existence of interactions between drugs and metabolic reactions suggests a potential way to discover drug targets.

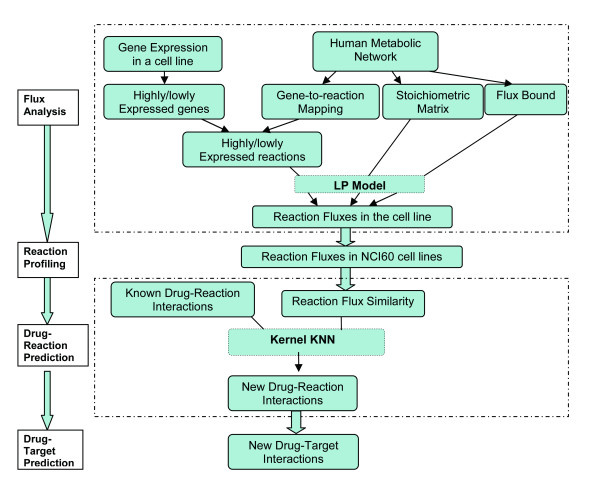
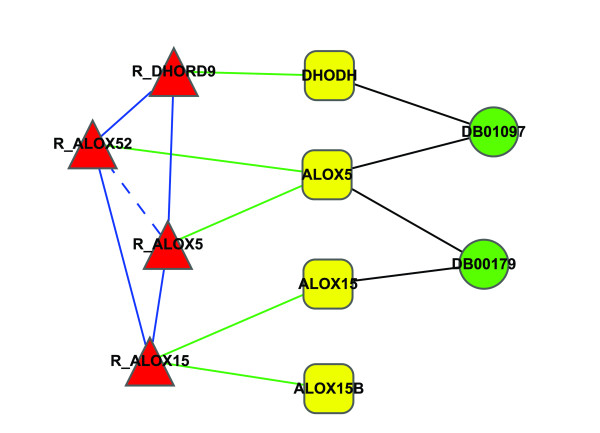
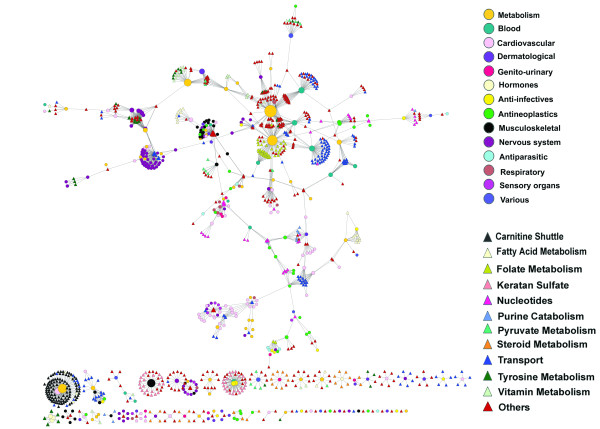
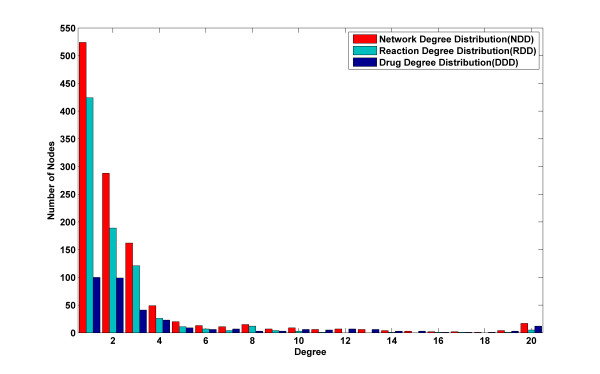
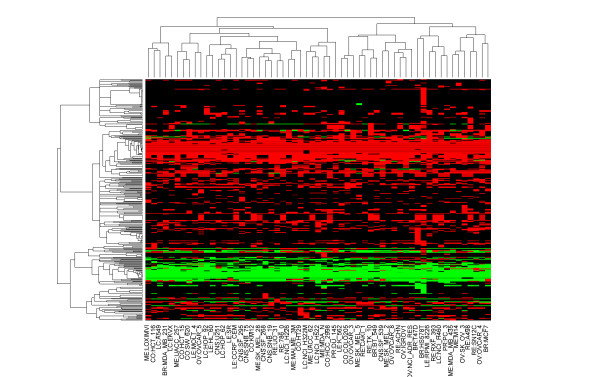
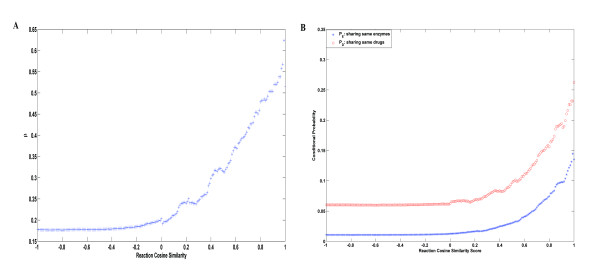
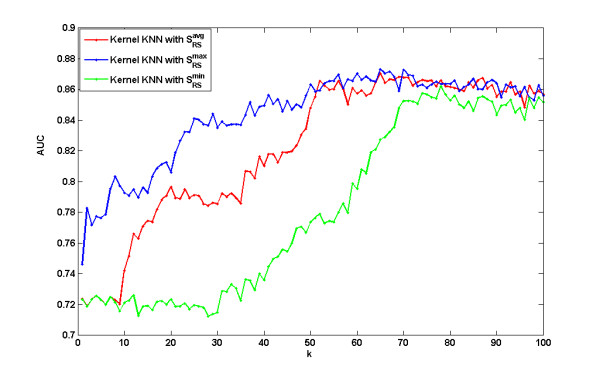
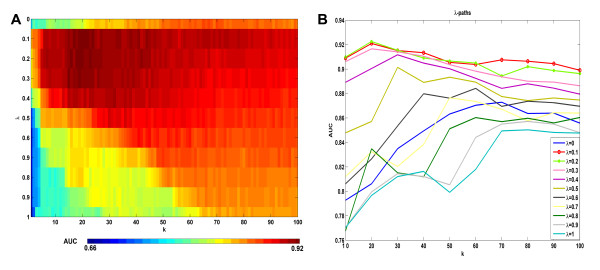
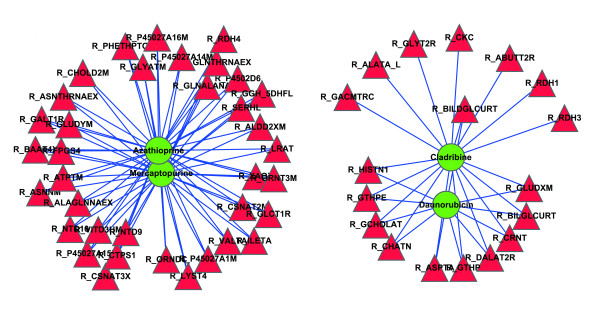
Results: In this paper, we present a computational method to predict new targets for approved anti-cancer drugs by exploring drug-reaction interactions. We construct a Drug-Reaction Network to provide a global view of drug-reaction interactions and drug-pathway interactions. The recent reconstruction of the human metabolic network and development of flux analysis approaches make it possible to predict each metabolic reaction's cell line-specific flux state based on the cell line-specific gene expressions. We first profile each reaction by its flux states in NCI-60 cancer cell lines, and then propose a kernel k-nearest neighbor model to predict related metabolic reactions and enzyme targets for approved cancer drugs. We also integrate the target structure data with reaction flux profiles to predict drug targets and the area under curves can reach 0.92.

Conclusions: The cross validations using the methods with and without metabolic network indicate that the former method is significantly better than the latter. Further experiments show the synergism of reaction flux profiles and target structure for drug target prediction. It also implies the significant contribution of metabolic network to predict drug targets. Finally, we apply our method to predict new reactions and possible enzyme targets for cancer drugs.


Figures

Figure 1
Figure 1
Flow chart for drug-target prediction. The 4-stage task includes flux analysis, reaction profiling, drug-reaction prediction and finally drug target prediction.
Figure 2
Figure 2
An illustrative example of the relationship between drugs, enzyme targets and metabolic reactions. Green circle, yellow rectangle and red triangle represent drug, protein and reaction, respectively. Black edge and green edge indicate drug-target interaction and reaction-enzyme relationship. The blue solid edge between two reactions indicates that two reactions interact with the same drug through different enzyme target, while blue dashed edge means that two reactions interact with the same drug through the same enzyme targets.
Figure 3
Figure 3
Drug-Reaction Network (DRN). DRN is generated by using the known interactions between approved drugs and their target reactions. Circles and triangles correspond to drugs and reactions, respectively. An edge between a drug node and a reaction node is placed if the drug targets at least one enzyme of the reaction. The area of the drug (reaction) node is proportional to the number of reactions (drugs) the drug (reaction) interacts with. Drug nodes are colored according to their Anatomical Therapeutic Chemical Classification, and reactions are colored according to their subsystems obtained from human metabolic network data.
Figure 4
Figure 4
Degree distribution in Drug-Reaction Network: Red represents the histogram for all nodes in DRN. Green and blue represent the histograms for drug nodes and reaction nodes, respectively.
Figure 5
Figure 5
Heat map of metabolic reaction profiles using complete linkage algorithm. Rows represent different reactions, and columns represent different cell lines. Red and green indicate different directions of metabolic reactions, while black indicates a flux value very close to zero.
Figure 6
Figure 6
Analysis for reaction flux similarity sRF. 6A: the change of β as the cutoff value of reaction similarity changes; 6B: PE(t)and PD(t) are increasing functions of t.
Figure 7
Figure 7
Comparison of the kernel KNN method with different reaction structure similarity smaxRS, savgRS and sminRS. The three curves show how the corresponding prediction AUCs change when the parameter k changes.
Figure 8
Figure 8
The prediction performance by the integration of reaction profiles with target sequence. 8A: The heat map of the mean AUCs at all considered λ and k. 8B: The λ-paths of the heat map.
Figure 9
Figure 9
Top 100 predicted related reactions for cancer drugs. Red and green nodes represent reactions and drugs, respectively.

Similar articles

Cited by

References

    1. Ma H, Goryanin I. Human metabolic network reconstruction and its impact on drug discovery and development. Drug Discovery Today. 2008;13:402–408. doi: 10.1016/j.drudis.2008.02.002. - DOI - PubMed
    1. Imming P, Sinning C, Meyer A. Opinion - Drugs, their targets and the nature and number of drug targets. Nat Rev Drug Discov. 2006;5:821–834. doi: 10.1038/nrd2132. - DOI - PubMed
    1. Overington JP, Al-Lazikani B, Hopkins AL. How many drug targets are there? Nat Rev Drug Discov. 2006;5:993–996. doi: 10.1038/nrd2199. - DOI - PubMed
    1. Ma HW, Sorokin A, Mazein A, Selkov A, Selkov E, Demin O, Goryanin I. The Edinburgh human metabolic network reconstruction and its functional analysis. Mol Syst Biol. 2007;3:8. doi: 10.1038/msb4100177. - DOI - PMC - PubMed
    1. Duarte NC, Becker SA, Jamshidi N, Thiele I, Mo ML, Vo TD, Srivas R, Palsson BO. Global reconstruction of the human metabolic network based on genomic and bibliomic data. Proc Natl Acad Sci USA. 2007;104:1777–1782. doi: 10.1073/pnas.0610772104. - DOI - PMC - PubMed

Publication types

MeSH terms

LinkOut - more resources