. 2010 Oct 8:10:539.
doi: 10.1186/1471-2407-10-539.

Genome profiling of ERBB2-amplified breast cancers

Affiliations

Genome profiling of ERBB2-amplified breast cancers

Fabrice Sircoulomb et al. BMC Cancer. .

Abstract

Background: Around 20% of breast cancers (BC) show ERBB2 gene amplification and overexpression of the ERBB2 tyrosine kinase receptor. They are associated with a poor prognosis but can benefit from targeted therapy. A better knowledge of these BCs, genomically and biologically heterogeneous, may help understand their behavior and design new therapeutic strategies.

Methods: We defined the high resolution genome and gene expression profiles of 54 ERBB2-amplified BCs using 244K oligonucleotide array-comparative genomic hybridization and whole-genome DNA microarrays. Expression of ERBB2, phosphorylated ERBB2, EGFR, IGF1R and FOXA1 proteins was assessed by immunohistochemistry to evaluate the functional ERBB2 status and identify co-expressions.

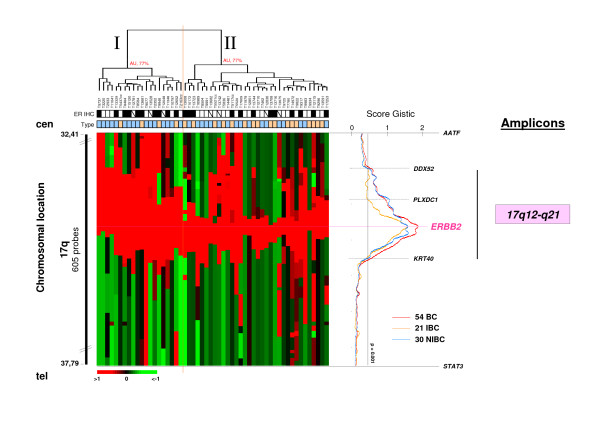
Results: First, we identified the ERBB2-C17orf37-GRB7 genomic segment as the minimal common 17q12-q21 amplicon, and CRKRS and IKZF3 as the most frequent centromeric and telomeric amplicon borders, respectively. Second, GISTIC analysis identified 17 other genome regions affected by copy number aberration (CNA) (amplifications, gains, losses). The expression of 37 genes of these regions was deregulated. Third, two types of heterogeneity were observed in ERBB2-amplified BCs. The genomic profiles of estrogen receptor-positive (ER+) and negative (ER-) ERBB2-amplified BCs were different. The WNT/β-catenin signaling pathway was involved in ER- ERBB2-amplified BCs, and PVT1 and TRPS1 were candidate oncogenes associated with ER+ ERBB2-amplified BCs. The size of the ERBB2 amplicon was different in inflammatory (IBC) and non-inflammatory BCs. ERBB2-amplified IBCs were characterized by the downregulated and upregulated mRNA expression of ten and two genes in proportion to CNA, respectively. IHC results showed (i) a linear relationship between ERBB2 gene amplification and its gene and protein expressions with a good correlation between ERBB2 expression and phosphorylation status; (ii) a potential signaling cross-talk between EGFR or IGF1R and ERBB2, which could influence response of ERBB2-positive BCs to inhibitors. FOXA1 was frequently coexpressed with ERBB2 but its expression did not impact on the outcome of patients with ERBB2-amplified tumors.

Conclusion: We have shown that ER+ and ER- ERBB2-amplified BCs are different, distinguished ERBB2 amplicons in IBC and non-IBC, and identified genomic features that may be useful in the design of alternative therapeutical strategies.


Figures

Figure 1
Figure 1
aCGH profiling of ERBB2-amplifed BCs. Unsupervised hierarchical clustering of genome copy number profiles measured for 54 ERBB2-amplified primary breast tumors by aCGH on 225,388 probes (without X and Y). Red indicates increased genome copy number and green indicates decreased genome copy number. The bars to the left indicate chromosome locations with chromosome 1pter to the top and 22qter to the bottom. The location of the odd-numbered chromosomes is indicated at left. The vertical orange dotted line defines the limits of the two major sample clusters defined by their respective AU (approximately unbiased) p-values Below the dendrogram, name of tumors are given and the rows indicate their ER and PR IHC status (black square, ER+ or PR+; white square, ER- or PR-). CNA frequencies discriminate ER+ and ER- ERBB2-amplified breast tumors (see also Additionnal file 1-Table S3). On the right, frequencies of CNA (gains and losses) are plotted as a function of chromosome location. Horizontal lines indicate chromosome boundaries. Positive and negative values indicate frequencies of tumors showing copy number increase and decrease, respectively, with gains and losses as described in the method section.
Figure 2
Figure 2
17q12-q21-amplicon as the most significant on 17q. Unsupervised hierarchical clustering of genome copy number profiles measured for 54 ERBB2-aplified primary breast tumors by aCGH on 5,574 17q probes. Legend is similar to Figure 1. The bar to the left indicates chromosome 17q location with centromere to the top and qter to the bottom. Below the dendrogram, name of tumors are given and the rows indicate their ER and PR IHC status (black square, ER+ or PR+; white square, ER- or PR-). Color codes and corresponding legends are indicated in the box located to the top right. On the right, combining the CNA frequency and gene amplification level, the GISTIC algorithm plotted the score index as a function of chromosome location. AATF and STAT3 delineate the genomic fragment that defined the ERBB2-amplicon. The green line indicates the threshold of significance for the score. Previous studies have reported that the 17q arm is the site of multiple amplicons. They are indicated by black bars at the right of the plot score. The Figure shows only 17q12-q21 (pink box) centered on the ERBB2 locus as the significant 17q amplicon (p < 0.001).
Figure 3
Figure 3
ERBB2-amplicon size is significantly different in ERBB2-amplified IBC and NIBC. Unsupervised hierarchical clustering of genome copy number profiles measured for 54 ERBB2-amplified primary breast tumors by aCGH on 650 17q12-q21 probes within the genomic interval defined from centromere to telomere by [AATF-STAT3] (bar to the left) (Additionnal file 1-Table S5). Below the dendrogram, name of tumors are given and the row indicates their ER (black square, ER+; white square, ER-) and IBC/NIBC (orange and blue boxes, respectively) status, respectively. Corresponding legends are indicated in the box located to the top right. On the right, the scores obtained for all BCs, IBCs and NIBCs are plotted (red, orange and blue lines, respectively) as a function of chromosome location. ERBB2-amplicon size varies within a region delimited by DDX52 and KRT40 genes. IBCs have a smaller amplicon than NIBCs located within a region delimited by PLXDC1 and KRT40 genes.
Figure 4
Figure 4
Supervised classification of ER+ and ER- ERBB2-amplified BCs based on RNA expression data. Left, classification of 51 samples using a 638-gene expression signature (listed in Additionnal file 1-Table S7C). Top panel, matrix of expression data. Each row of the data matrix represents a gene and each column represents a sample. Expression levels are depicted according to the color scale shown at the bottom. Red and green indicate expression levels respectively above and below the median. The magnitude of deviation from the median is represented by the color saturation. Genes are ordered from top to bottom by their decreasing signal-to-noise ratio. Tumor samples are ordered from left to right according to the decreasing correlation coefficient of their expression profile with the median profile of the ER+ samples (Bottom panel). The orange line indicates the threshold 0 that separates the two predicted classes of samples, "ER+ class" (to the left) and "ER- class" (to the right). The middle panel indicates the observed ER status of tumors (black square, ER+; white square, ER-). Right, correlation between the molecular grouping based on the combined expression of the 638 genes (predicted status) and the observed ER status of samples.
Figure 5
Figure 5
Immunohistochemical expression analysis in ERBB2-amplified tumors. Two exemples of IHC profile of ERBB2-amplified cases. The IHC profiles show in ERBB2-amplified ERBB2-positive (a-f) an ERBB2 expression defined as 3+ with Herceptest (a) and TAB250 (b) as well as a cytoplasmic positivity of pERBB2 (c) a cell membrane positivity of IFG1R (d) and an absence of FOXA1 (e) and EGFR (f) expression. The IHC profiles show in ERBB2-amplified ERBB2-negative (g-m) an ERBB2 expression defined as 0+ with Herceptest (h) and TAB250 (i) as well as a weak cytoplasmic positivity of pERBB2 (j) no positivity of cell membrane of IFG1R (k), a strong nuclear expression of FOXA1 (l) and an absence of EGFR (m).

Similar articles

Cited by

References

    1. Chin K, DeVries S, Fridlyand J, Spellman PT, Roydasgupta R, Kuo WL, Lapuk A, Neve RM, Qian Z, Ryder T, Chen F, Feiler H, Tokuyasu T, Kingsley C, Dairkee S, Meng Z, Chew K, Pinkel D, Jain A, Ljung BM, Esserman L, Albertson DG, Waldman FM, Gray JW. Genomic and transcriptional aberrations linked to breast cancer pathophysiologies. Cancer Cell. 2006;10:529–541. - PubMed
    1. Letessier A, Sircoulomb F, Ginestier C, Cervera N, Monville F, Gelsi-Boyer V, Esterni B, Geneix J, Finetti P, Zemmour C, Viens P, Charafe-Jauffret E, Jacquemier J, Birnbaum D, Chaffanet M. Frequency, prognosis impact and subtype association of 8p12, 8q24, 11q13, 12p13, 17q12 and 20q13 amplifications in breast cancers. BMC Cancer. 2006;6:245. - PMC - PubMed
    1. Adélaïde J, Finetti P, Bekhouche I, Repellini L, Geneix J, Sircoulomb F, Charafe-Jauffret E, Cervera N, Desplans J, Parzy D, Schoenmakers E, Viens P, Jacquemier J, Birnbaum D, Bertucci F, Chaffanet M. Integrated profiling of basal and luminal breast cancers. Cancer Res. 2007;67:11565–11575. - PubMed
    1. Konecny GE, Pegram MD, Venkatesan N, Finn R, Yang G, Rahmeh M, Untch M, Rusnak DW, Spehar G, Mullin RJ, Keith BR, Gilmer TM, Berger M, Podratz KC, Slamon DJ. Activity of the dual kinase inhibitor lapatinib (GW572016) against HER-2-overexpressing and trastuzumab-treated breast cancer cells. Cancer Res. 2006;66:1630–639. - PubMed
    1. Shepard HM, Jin P, Slamon DJ, Pirot Z, Maneval DC. Herceptin. Handb Exp Pharmacol. 2008;181:183–219. - PubMed

Publication types