

Molecular and phylogenetic characterization of the sieve element occlusion gene family in Fabaceae and non-Fabaceae plants
- PMID: 20932300
- PMCID: PMC3017817
- DOI: 10.1186/1471-2229-10-219
Molecular and phylogenetic characterization of the sieve element occlusion gene family in Fabaceae and non-Fabaceae plants
Abstract
Background: The phloem of dicotyledonous plants contains specialized P-proteins (phloem proteins) that accumulate during sieve element differentiation and remain parietally associated with the cisternae of the endoplasmic reticulum in mature sieve elements. Wounding causes P-protein filaments to accumulate at the sieve plates and block the translocation of photosynthate. Specialized, spindle-shaped P-proteins known as forisomes that undergo reversible calcium-dependent conformational changes have evolved exclusively in the Fabaceae. Recently, the molecular characterization of three genes encoding forisome components in the model legume Medicago truncatula (MtSEO1, MtSEO2 and MtSEO3; SEO = sieve element occlusion) was reported, but little is known about the molecular characteristics of P-proteins in non-Fabaceae.
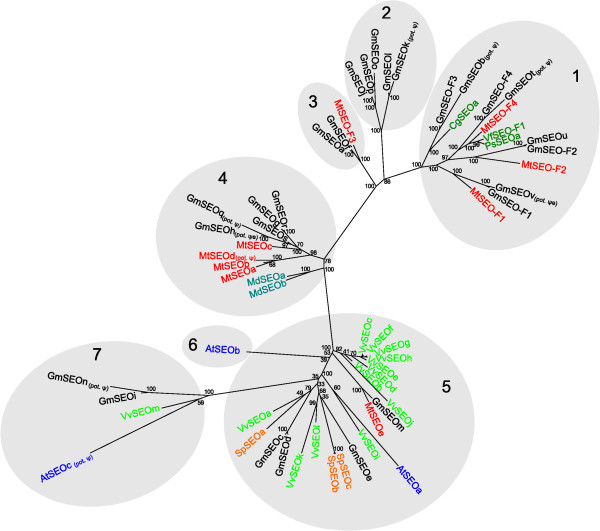
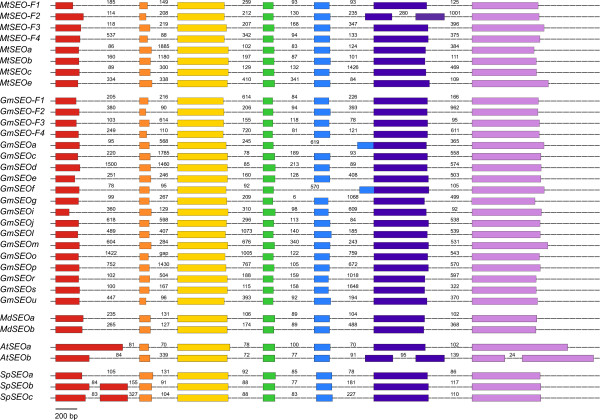
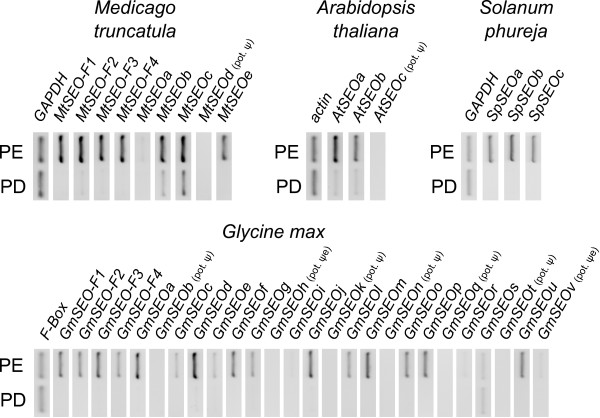
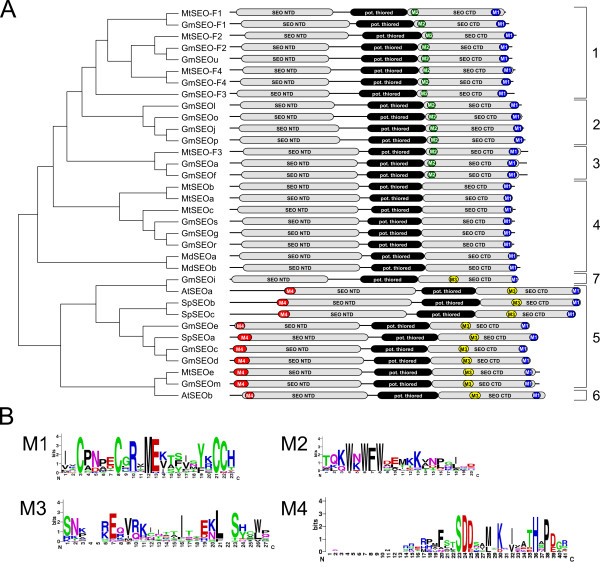
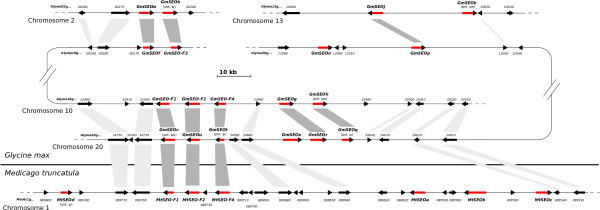
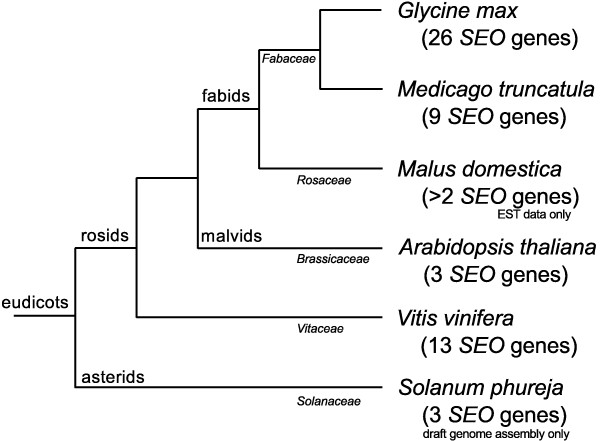
Results: We performed a comprehensive genome-wide comparative analysis by screening the M. truncatula, Glycine max, Arabidopsis thaliana, Vitis vinifera and Solanum phureja genomes, and a Malus domestica EST library for homologs of MtSEO1, MtSEO2 and MtSEO3 and identified numerous novel SEO genes in Fabaceae and even non-Fabaceae plants, which do not possess forisomes. Even in Fabaceae some SEO genes appear to not encode forisome components. All SEO genes have a similar exon-intron structure and are expressed predominantly in the phloem. Phylogenetic analysis revealed the presence of several subgroups with Fabaceae-specific subgroups containing all of the known as well as newly identified forisome component proteins. We constructed Hidden Markov Models that identified three conserved protein domains, which characterize SEO proteins when present in combination. In addition, one common and three subgroup specific protein motifs were found in the amino acid sequences of SEO proteins. SEO genes are organized in genomic clusters and the conserved synteny allowed us to identify several M. truncatula vs G. max orthologs as well as paralogs within the G. max genome.
Conclusions: The unexpected occurrence of forisome-like genes in non-Fabaceae plants may indicate that these proteins encode species-specific P-proteins, which is backed up by the phloem-specific expression profiles. The conservation of gene structure, the presence of specific motifs and domains and the genomic synteny argue for a common phylogenetic origin of forisomes and other P-proteins.
Figures
Similar articles
-
Calcium powered phloem protein of SEO gene family "Forisome" functions in wound sealing and act as biomimetic smart materials.Plant Signal Behav. 2014;9(9):e29438. doi: 10.4161/psb.29438. Plant Signal Behav. 2014. PMID: 25763691 Free PMC article. Review.
-
The sieve element occlusion gene family in dicotyledonous plants.Plant Signal Behav. 2011 Jan;6(1):151-3. doi: 10.4161/psb.6.1.14308. Epub 2011 Jan 1. Plant Signal Behav. 2011. PMID: 21422825 Free PMC article.
-
Characterization of five subgroups of the sieve element occlusion gene family in Glycine max reveals genes encoding non-forisome P-proteins, forisomes and forisome tails.Plant Mol Biol. 2014 Sep;86(1-2):51-67. doi: 10.1007/s11103-014-0211-z. Epub 2014 Jun 14. Plant Mol Biol. 2014. PMID: 24928491
-
Molecular and ultrastructural analysis of forisome subunits reveals the principles of forisome assembly.Ann Bot. 2014 Jun;113(7):1121-37. doi: 10.1093/aob/mcu036. Epub 2014 Apr 2. Ann Bot. 2014. PMID: 24694827 Free PMC article.
-
Calcium-energized motor protein forisome controls damage in phloem: potential applications as biomimetic "smart" material.Crit Rev Biotechnol. 2015 Jun;35(2):173-83. doi: 10.3109/07388551.2013.823598. Epub 2013 Sep 11. Crit Rev Biotechnol. 2015. PMID: 24020505 Review.
Cited by
-
Interactions among tobacco sieve element occlusion (SEO) proteins.Plant Signal Behav. 2012 Dec;7(12):1724-6. doi: 10.4161/psb.22452. Epub 2012 Oct 16. Plant Signal Behav. 2012. PMID: 23072990 Free PMC article.
-
Calcium powered phloem protein of SEO gene family "Forisome" functions in wound sealing and act as biomimetic smart materials.Plant Signal Behav. 2014;9(9):e29438. doi: 10.4161/psb.29438. Plant Signal Behav. 2014. PMID: 25763691 Free PMC article. Review.
-
Differentiation of vascular elements in haustoria of Cuscuta japonica.Plant Signal Behav. 2018 Mar 4;13(3):e1445935. doi: 10.1080/15592324.2018.1445935. Epub 2018 Mar 22. Plant Signal Behav. 2018. PMID: 29485934 Free PMC article.
-
The Ca2+ response of a smart forisome protein is dependent on polymerization.Protein Sci. 2022 Mar;31(3):602-612. doi: 10.1002/pro.4256. Epub 2021 Dec 18. Protein Sci. 2022. PMID: 34897845 Free PMC article.
-
Species-Specific and Distance-Dependent Dispersive Behaviour of Forisomes in Different Legume Species.Int J Mol Sci. 2021 Jan 6;22(2):492. doi: 10.3390/ijms22020492. Int J Mol Sci. 2021. PMID: 33419062 Free PMC article.
References
-
- Esau K. The Phloem. Stuttgart: Borntraeger; 1969.
-
- Münch E. Die Stoffbewegungen in der Pflanze. Jena: Fischer Verlag; 1930.
-
- van Bel A, Kempers R. The pore/plasmodesm unit: key element in the interplay between sieve element and companion cell. Progress in Botany. 1996;58:278–291.
Publication types
MeSH terms
Substances
LinkOut - more resources
Full Text Sources
Other Literature Sources
Molecular Biology Databases
Research Materials
