

In silico modeling indicates the development of HIV-1 resistance to multiple shRNA gene therapy differs to standard antiretroviral therapy
- PMID: 20932334
- PMCID: PMC2959037
- DOI: 10.1186/1742-4690-7-83
In silico modeling indicates the development of HIV-1 resistance to multiple shRNA gene therapy differs to standard antiretroviral therapy
Abstract
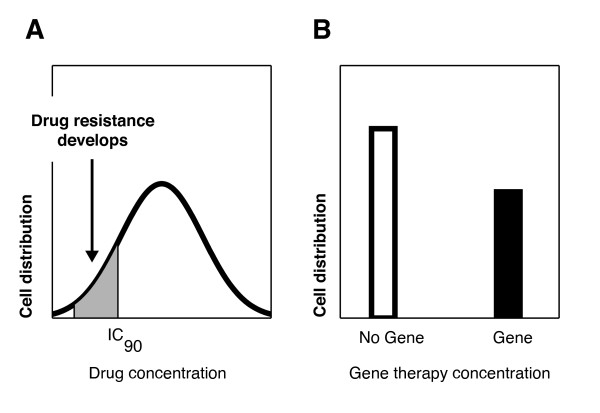
Background: Gene therapy has the potential to counter problems that still hamper standard HIV antiretroviral therapy, such as toxicity, patient adherence and the development of resistance. RNA interference can suppress HIV replication as a gene therapeutic via expressed short hairpin RNAs (shRNAs). It is now clear that multiple shRNAs will likely be required to suppress infection and prevent the emergence of resistant virus.
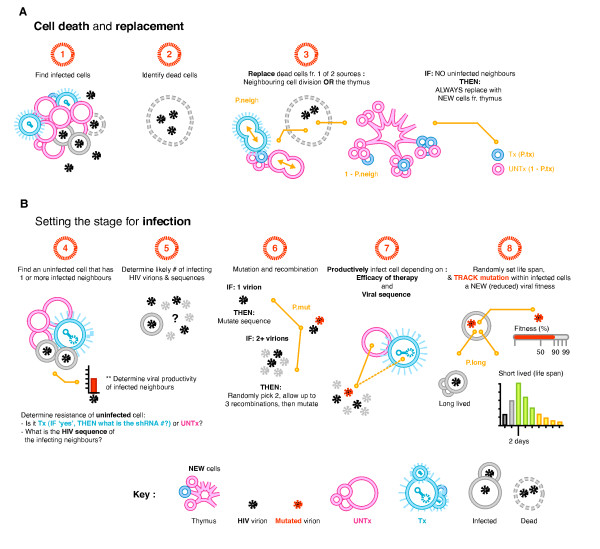
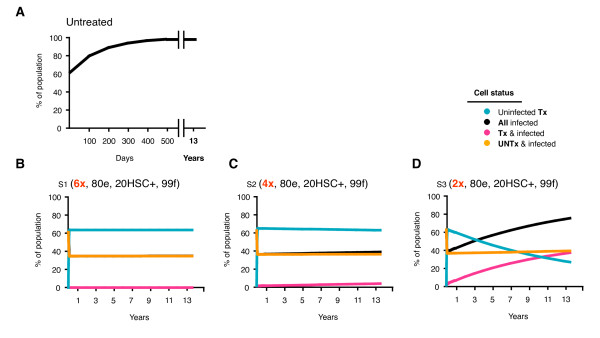
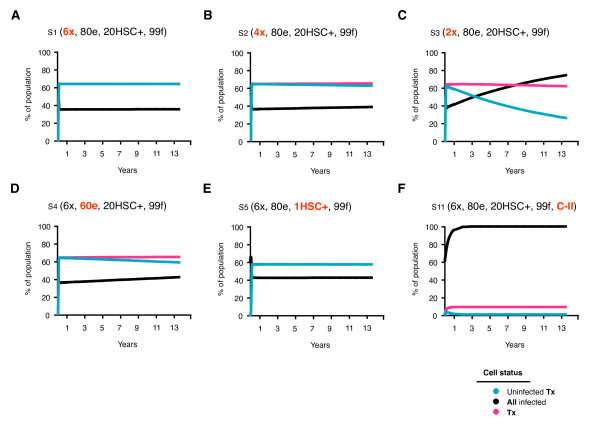
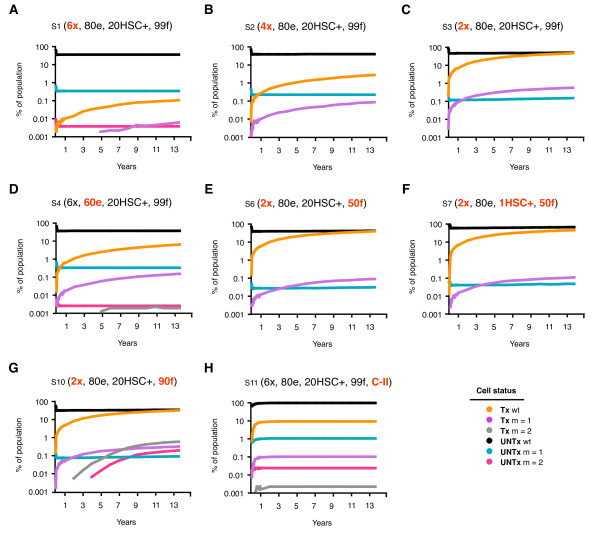
Results: We have developed the first biologically relevant stochastic model in which multiple shRNAs are introduced into CD34+ hematopoietic stem cells. This model has been used to track the production of gene-containing CD4+ T cells, the degree of HIV infection, and the development of HIV resistance in lymphoid tissue for 13 years. In this model, we found that at least four active shRNAs were required to suppress HIV infection/replication effectively and prevent the development of resistance. The inhibition of incoming virus was shown to be critical for effective treatment. The low potential for resistance development that we found is largely due to a pool of replicating wild-type HIV that is maintained in non-gene containing CD4+ T cells. This wild-type HIV effectively out-competes emerging viral strains, maintaining the viral status quo.
Conclusions: The presence of a group of cells that lack the gene therapeutic and is available for infection by wild-type virus appears to mitigate the development of resistance observed with systemic antiretroviral therapy.
Figures
Similar articles
-
Engineering HIV-1-resistant T-cells from short-hairpin RNA-expressing hematopoietic stem/progenitor cells in humanized BLT mice.PLoS One. 2012;7(12):e53492. doi: 10.1371/journal.pone.0053492. Epub 2012 Dec 31. PLoS One. 2012. PMID: 23300932 Free PMC article.
-
Study of the impact of HIV genotypic drug resistance testing on therapy efficacy.Verh K Acad Geneeskd Belg. 2001;63(5):447-73. Verh K Acad Geneeskd Belg. 2001. PMID: 11813503 Review.
-
Cassette deletion in multiple shRNA lentiviral vectors for HIV-1 and its impact on treatment success.Virol J. 2009 Oct 30;6:184. doi: 10.1186/1743-422X-6-184. Virol J. 2009. PMID: 19878571 Free PMC article.
-
Inhibition of human immunodeficiency virus type 1 by RNA interference using long-hairpin RNA.Gene Ther. 2006 Oct;13(19):1403-13. doi: 10.1038/sj.gt.3302786. Epub 2006 May 18. Gene Ther. 2006. PMID: 16708080 Free PMC article.
-
Small RNAs to treat human immunodeficiency virus type 1 infection by gene therapy.Curr Opin Virol. 2019 Oct;38:10-20. doi: 10.1016/j.coviro.2019.04.003. Epub 2019 May 18. Curr Opin Virol. 2019. PMID: 31112858 Review.
Cited by
-
A comparison of multiple shRNA expression methods for combinatorial RNAi.Genet Vaccines Ther. 2011 Apr 17;9(1):9. doi: 10.1186/1479-0556-9-9. Genet Vaccines Ther. 2011. PMID: 21496330 Free PMC article.
-
Creating genetic resistance to HIV.Curr Opin Immunol. 2012 Oct;24(5):625-32. doi: 10.1016/j.coi.2012.08.013. Epub 2012 Sep 15. Curr Opin Immunol. 2012. PMID: 22985479 Free PMC article. Review.
-
A quantitative comparison of anti-HIV gene therapy delivered to hematopoietic stem cells versus CD4+ T cells.PLoS Comput Biol. 2014 Jun 19;10(6):e1003681. doi: 10.1371/journal.pcbi.1003681. eCollection 2014 Jun. PLoS Comput Biol. 2014. PMID: 24945407 Free PMC article.
-
Multiple shRNA combinations for near-complete coverage of all HIV-1 strains.AIDS Res Ther. 2011 Jan 13;8(1):1. doi: 10.1186/1742-6405-8-1. AIDS Res Ther. 2011. PMID: 21226969 Free PMC article.
-
MicroRNAs and human retroviruses.Biochim Biophys Acta. 2011 Nov-Dec;1809(11-12):686-93. doi: 10.1016/j.bbagrm.2011.05.009. Epub 2011 May 24. Biochim Biophys Acta. 2011. PMID: 21640212 Free PMC article. Review.
References
Publication types
MeSH terms
Substances
LinkOut - more resources
Full Text Sources
Medical
Research Materials
