Review
. 2011 Jan;28(1):95-108.
doi: 10.1017/S0952523810000209. Epub 2010 Oct 8.

Multiple pathways of inhibition shape bipolar cell responses in the retina

Affiliations
Review

Multiple pathways of inhibition shape bipolar cell responses in the retina

Erika D Eggers et al. Vis Neurosci. 2011 Jan.

Abstract

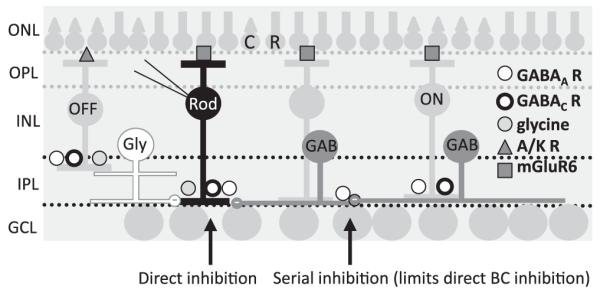
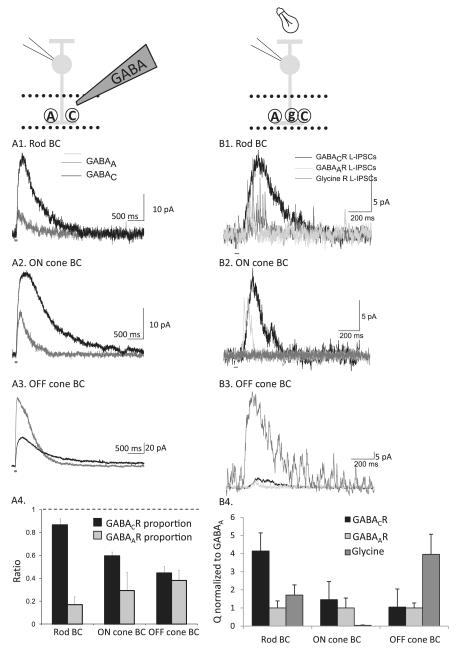
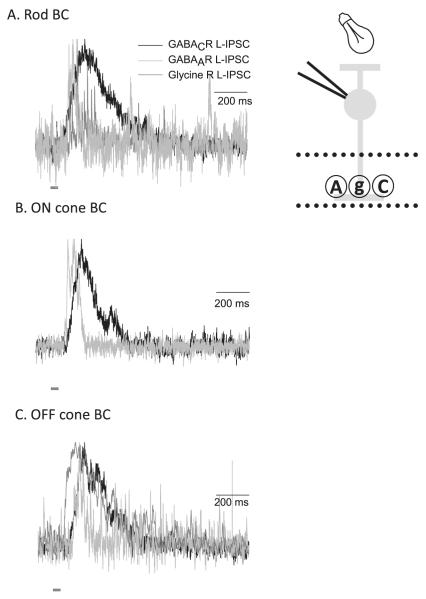
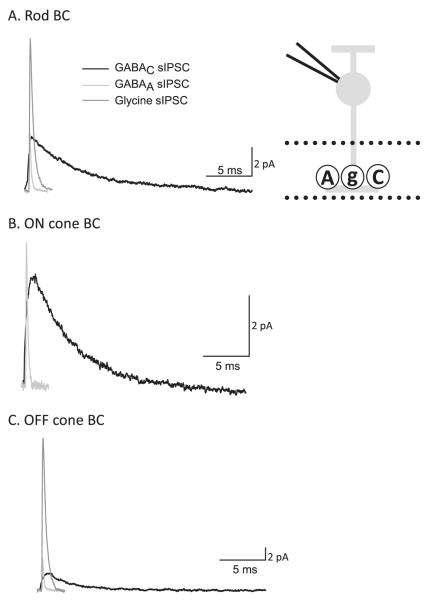
Bipolar cells (BCs) are critical relay neurons in the retina that are organized into parallel signaling pathways. The three main signaling pathways in the mammalian retina are the rod, ON cone, and OFF cone BCs. Rod BCs mediate incrementing dim light signals from rods, and ON cone and OFF cone BCs mediate incrementing and decrementing brighter light signals from cones, respectively. The outputs of BCs are shaped by inhibitory inputs from GABAergic and glycinergic amacrine cells in the inner plexiform layer, mediated by three distinct types of inhibitory receptors: GABA(A), GABA(C), and glycine receptors. The three main BC pathways receive distinct forms of inhibition from these three receptors that shape their light-evoked inhibitory signals. Rod BC inhibition is dominated by slow GABA(C) receptor inhibition, while OFF cone BCs are dominated by glycinergic inhibition. The inhibitory inputs to BCs are also shaped by serial inhibitory connections between GABAergic amacrine cells that limit the spatial profile of BC inhibition. We discuss our recent studies on how inhibitory inputs to BCs are shaped by receptor expression, receptor properties, and neurotransmitter release properties and how these affect the output of BCs.


Figures

Fig. 1
Fig. 1
Inhibition to retinal BCs. A cartoon of the retina is shown with the rod (R) and cone (C) photoreceptors in the outer nuclear layer (ONL) that make connections with the BCs in the outer plexiform layer (OPL). BCs and amacrine cells are located in the inner nuclear layer (INL) and make contacts with the ganglion cells (GCL) in the inner plexiform layer (IPL). BCs receive inhibitory inputs from glycinergic (Gly, white) and GABAergic (GAB, dark gray) amacrine cells that have distinct spatial extents in the retina. Rod and OFF cone BCs (OFF) receive inhibitory inputs onto GABAA, GABAC, and glycine receptors (R), while ON cone BCs (ON) receive inputs onto GABAA and GABACRs, all of which is direct inhibition. Glutamatergic inputs to BCs are mediated by two distinct types of glutamate receptors, AMPA/kainate receptors in the OFF pathway (A/K R) and mGluR6s in the ON pathway, including rod and ON cone BCs. GABAergic amacrine cells also receive inhibitory inputs from other GABAergic amacrine cells that are mediated by GABAARs (serial inhibition). The illustrated pathway shows inhibition onto BCs, but the cone BCs receive similar inhibition (see text).
Fig. 2
Fig. 2
The contributions of GABAA, GABAC, and glycineR currents vary across BC class. (A) GABA-evoked currents were measured in BCs by focally applying GABA to the BC axon terminal (inset). GABAAR- or GABACR-mediated currents were isolated and measured using (1,2,5,6-Tetrahydropyridin-4-yl)methylphosphinic acid (TPMPA) (50 μM) or bicuculline (50 μM), respectively in: rod (A1), ON cone (A2), and OFF cone (A3) BCs. (The dark gray bar below each trace indicates the duration of the GABA puff.) (A4) Fractional GABA-evoked current mediated by GABAAR and GABACRs in BC types was calculated by normalizing GABAAR and GABACR charge transfer (Q) to total Q. In rod and ON cone BCs, GABACRs (black bars) mediated significantly more of the total response (Q) than GABAARs (gray bars; P < 0.001 and 0.005, respectively). In OFF cone BCs, the proportion of GABAAR and GABACR contributions was similar (P = 0.3). The error bars represent the s.e.m.(B) L-IPSCs were recorded from BCs voltage clamped to 0 mV, the reversal potential for excitatory currents mediated by nonselective cation channels, and elicited with a 30-ms full-field stimulus (dark gray bar), as shown in the inset. (B1) Rod BCs have large L-IPSCs mediated by GABACRs (in strychnine 500 nM and bicuculline 50 μM) and modest L-IPSCs mediated by glycine (in TPMPA, 50 μM, and bicuculline,50 μM) and GABAARs (in TPMPA 50 μM and bicuculline 50 μM). (B2) ON BCs have moderate GABACR and GABAAR L-IPSCs and no glycinergic currents. (B3) OFF cone BCs have large glycinergic L-IPSCs and smaller GABAAR and GABACRL-IPSCs. (B4) The average Q of GABAAR, GABACR, and glycineR L-IPSCs was normalized to the Q of GABAARL-IPSCs for each BC type. Rod BCs have proportionately the largest GABACR L-IPSCs, and OFF cone BCs have the largest glycinergic L-IPSCs. Portions of this figure were adapted from Eggers et al. (2007), Journal of Physiology.
Fig. 3
Fig. 3
GABACR, GABAAR, and glycineRs mediate L-IPSCs with distinct time courses in all BC classes. L-IPSCs were recorded from BCs voltage clamped to 0 mV, the reversal potential for excitatory currents mediated by nonselective cation channels, and elicited with a 30-ms full-field stimulus (dark gray bar). L-IPSCs were normalized to the peak of the response to illustrate kinetic differences. Receptors were isolated with combinations of antagonists, as in Fig. 2. (A) In rod BCs, GABACR L-IPSCs have a slower decay time and rise time than GABAAR or glycineR L-IPSCs. However, the decay time of glycineR L-IPSCs is slower than GABAAR L-IPSCs. (B) In ON cone BCs, GABAAR and GABACR L-IPSCs show similar kinetics as in rod BCs. (C) OFF cone BC L-IPSCs show similar kinetics differences as ON cone and rod BCs.
Fig. 4
Fig. 4
Spontaneous IPSCs (sIPCs) indicate that GABAAR, GABACR, and glycineRs show distinct biophysical properties. Shown are average sIPSCs from rod, ON cone, and OFF cone BCs (inset). (A) Rod BCs show spontaneous currents mediated by GABAAR, GABACR, and glycineRs, with distinct decay times. (B) ON cone BCs show sIPSCs mediated by only GABAAR and GABACRs, with no currents mediated by glycineRs. GABACR currents have a significantly longer decay time than GABAAR currents. (C) OFF cone BCs show sIPSCs mediated by GABAAR, GABACR, and glycineRs, with distinct decay times. The amplitude of glycineR sIPSCs is significantly larger than other sIPSCs consistent with the primary role of glycinergic inhibition in OFF cone BCs.
Fig. 5
Fig. 5
GABAAR-, GABACR-, and glycineR-mediated L-IPSCs have distinct apparent release functions and receptor kinetics, both of which contribute to L-IPSC kinetics. (A) Release functions computed by deconvolving idealized GABAAR- and GABACR-mediated L-IPSCs. GABAAR-mediated L-IPSCs have a much larger release function than GABACRs, likely because of the much smaller Q of GABAAR sIPSCs versus GABACR sIPSCs. The GABACR release function has a prolonged tail not shown by the GABAAR release function. Scale bars are 0.05 quanta/ms and 200 ms. (B) The release functions calculated from the deconvolution of the L-IPSCs and sIPSC traces for GABAAR and glycineRs are shown. The glycine release function has much slower decay time than the GABAAR release function. This suggests that part of the differences between GABAAR- and glycineR-mediated L-IPSCs are due to distinct release kinetics. This figure was adapted from Eggers and Lukasiewicz (2006b), Journal of Neuroscience.
Fig. 6
Fig. 6
GABACRs shape L-IPSCs in ON cone and rod BCs but not OFF cone BCs. (A–C) Representative L-IPSCs (30-ms light stimulus duration, gray bar) from rod (A), ON cone (B), and OFF cone (C) BCs in WT (black) and GABACR null (gray) mice. (D) The histogram plots the average L-IPSCs decay (D37) from GABACR null BCs normalized to WT. GABACR null L-IPSCs in rod BCs (WT n = 43, null n = 15, P < 0.0001) and ON cone BCs (WT n = 17, null n = 4, P < 0.05) were significantly briefer than WT. There was no significant difference in L-IPSC decays from GABACR null and WT OFF cone BCs (WT n = 13, null n = 6, P = 0.7). Error bars in (D) represent propagated s.e.s of the average null to WT values. Adapted from Eggers et al. (2007), Journal of Physiology.
Fig. 7
Fig. 7
The decay of combined glycinergic and GABAergic L-IPSCs varies with WT BC class. (A–C) Representative total L-IPSCs (glycinergic + GABAergic) from rod (A), ON cone (B), and OFF cone (C) BCs evoked by a light stimulus (30-ms light stimulus, dark gray bar). (D) The histogram plots the average decay (D37) from each BC class. L-IPSCs from rod BCs were significantly slower than ON cone BCs (rod 5 43, ON cone n = 17, ANOVA P < 0.001, rod vs. ON Scheffe post hoc P < 0.001, *) but similar to OFF cone BCs (n = 13, P = 0.86). The decay of L-IPSCs from OFF cone BCs also was significantly slower than ON cone BCs (P < 0.05, **). Adapted from Eggers et al. (2007), Journal of Physiology.
Fig. 8
Fig. 8
Presynaptic GABACR limit release, making L-EPSCs from A17 amacrine cells more transient. Glutamate release from rod BCs was monitored by recording L-EPSCs from postsynaptic A17 ACs. (A) The absence of GABACRs in GABACR null mice causes the L-EPSC to have a longer decay and larger charge transfer. A similar effect was observed in WT mice when TPMPA was added to block GABACRs. The decay (D37) of A17 amacrine cells from GABACR null mice (P < 0.05) and WT mice in TPMPA (P < 0.01) was significantly longer than WT mice in control conditions. (B) Presynaptic glycine and GABAARs decrease the peak response of L-EPSCs from A17 amacrine cells. The peak amplitude of L-EPSCs from A17 amacrine cells from GABACR null mice was increased by the addition of strychnine to block glycineRs, but the decay time of the response was unaffected. Similarly, the peak amplitude of L-EPSCs from A17 amacrine cells from GABACR null mice was increased by addition of bicuculline to block GABAARs, but the response decay was unaffected. The amplitude of L-EPSCs was significantly larger with the addition of both strychnine (P < 0.05, *) and bicuculline (P < 0.05, *). Peak values in bicuculline and strychnine are normalized to control values, represented by the dotted line.
Fig. 9
Fig. 9
(A) Serial inhibitory connections limit wide-field but not narrow-field BC L-IPSCs. (A) Wide-field (825 μm, A2) and narrow-field (25 μm, A2) light stimuli (A1, A2, and thick dark gray bar in traces) were applied to BCs. Bicuculline (50 μM) was added to block GABAARs. (B) In all BC types (OFF cone BC shown), blocking GABAARs increased the charge transfer (Q) of wide-field L-IPSCs (B1), suggesting that serial inhibitory connections between ACs limit wide-field light activated L-IPSCs (rod P < 0.05, ON P < 0.05, OFF P < 0.05). In contrast, blocking GABAARs decreased the Q of narrow-field L-IPSCs (B2), suggesting that narrow-field light activated only direct connections (rod n = 10, P < 0.001; ON n = 6, P < 0.01; OFF n = 5, P < 0.05). (C) The spatial responses of BC L-IPSCs are suppressed at large light stimulus sizes in control conditions but not when serial connections are blocked by bicuculline. Light stimuli of 10 different sizes (25–825 μm) were applied to BCs in control and bicuculline, and the Q of each L-IPSC was measured. The average area response function (ARFs) of all BCs recorded were normalized to the maximum light response for each BC and to the light size where the maximum response was elicited. ARFs showed a peak at an intermediate-sized light stimuli for all BC types in control (C1, rod n = 19, ON n = 14, OFF n = 9). When GABAAR-mediated serial connections are blocked, BC L-IPSCs show no suppression. The average ARFs of all BCs recorded in bicuculline were calculated (C2) and showed an increasing light response with increasing light stimulus size (rod n = 11, ON n = 5, OFF n = 5). This suggests that the spatial tuning of BC L-IPSCs seen in control conditions is limited by serial connections. Adapted from Eggers and Lukasiewicz (2010), Journal of Neurophysiology.
Fig. 10
Fig. 10
GABAAR, GABACR, and glycineRs control distinct properties of glutamate release from BCs. (A) GABAAR and glycineRs mediated light-evoked currents with a fast rise and decay, which primarily limit the peak of glutamate release from BCs. (B) GABACRs mediated light-evoked inhibition with slow decay, which primarily limits prolonged glutamate release from BCs. The time course of light-evoked BC inhibition is controlled both by biophysical receptor properties as well as prolonged GABA and glycine release from amacrine cells. (C) The magnitude of inhibition varies between BC pathways. Rod BCs receive large GABACR-mediated inhibition and less GABAAR and glycineR inhibition. ON cone BCs receive moderate amounts of GABAAR and GABACR inhibition with no glycinergic inhibition. OFF cone BCs receive little GABACR inhibition, some GABAAR inhibition, and are dominated by glycinergic inhibition. The magnitude of GABAergic inhibition is also controlled by GABAAR-mediated synapses between GABAergic amacrine cells that serve to limit inhibition to BCs.

Similar articles

Cited by

References

    1. Ashmore JF, Copenhagen DR. Different postsynaptic events in two types of retinal bipolar cell. Nature. 1980;288:84–86. - PubMed
    1. Awatramani GB, Slaughter MM. Origin of transient and sustained responses in ganglion cells of the retina. The Journal of Neuroscience. 2000;20:7087–7095. - PMC - PubMed
    1. Cadetti L, Tranchina D, Thoreson WB. A comparison of release kinetics and glutamate receptor properties in shaping rod-cone differences in EPSC kinetics in the salamander retina. The Journal of Physiology. 2005;569:773–788. - PMC - PubMed
    1. Chang Y, Weiss DS. Channel opening locks agonist onto the GABAC receptor. Nature Neuroscience. 1999;2:219–225. - PubMed
    1. Chavez AE, Diamond JS. Diverse mechanisms underlie glycinergic feedback transmission onto rod bipolar cells in rat retina. The Journal of Neuroscience. 2008;28:7919–7928. - PMC - PubMed