Review
. 2010 Nov;14(11):506-15.
doi: 10.1016/j.tics.2010.09.001.

The functional role of cross-frequency coupling

Affiliations
Review

The functional role of cross-frequency coupling

Ryan T Canolty et al. Trends Cogn Sci. 2010 Nov.

Abstract

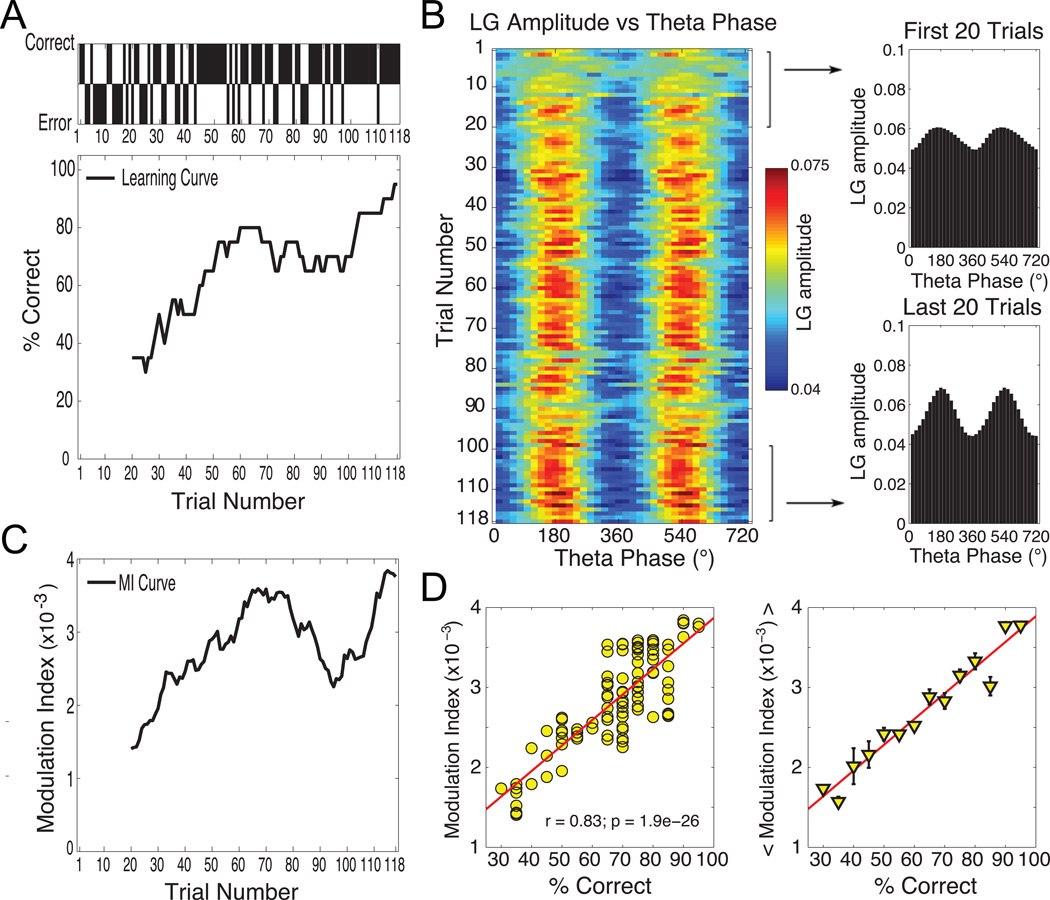
Recent studies suggest that cross-frequency coupling (CFC) might play a functional role in neuronal computation, communication and learning. In particular, the strength of phase-amplitude CFC differs across brain areas in a task-relevant manner, changes quickly in response to sensory, motor and cognitive events, and correlates with performance in learning tasks. Importantly, whereas high-frequency brain activity reflects local domains of cortical processing, low-frequency brain rhythms are dynamically entrained across distributed brain regions by both external sensory input and internal cognitive events. CFC might thus serve as a mechanism to transfer information from large-scale brain networks operating at behavioral timescales to the fast, local cortical processing required for effective computation and synaptic modification, thus integrating functional systems across multiple spatiotemporal scales.


Figures

Figure 1
Figure 1. Phase-amplitude cross-frequency coupling (CFC) occurs between distinct brain rhythms, but varies as a function of cortical area and task demands
A) Example of theta phase-locked modulation of low and high gamma power. (Top) time-frequency plot of mean power modulation time-locked to the theta trough. (Bottom) Theta trough-locked average of raw electrocorticogram (ECoG) signal. B) Modulation strength as a function of frequency for amplitude and frequency for phase. Note that the strongest modulation for this electrode occurs between theta phase and high gamma amplitude. C) During auditory tasks, theta/gamma CFC is stronger than alpha/gamma CFC over anterior sites. Theta/gamma CFC is equal across the cortex whereas posterior alpha/gamma CFC is larger than anterior alpha/gamma CFC. D) During visual tasks, alpha/gamma CFC is stronger on average at posterior electrode sites and is greater than theta/gamma CFC. For both C and D, electrode color signifies the low frequency bias in coupling with high gamma amplitude; red indicates greater theta/gamma CFC compared to alpha/gamma CFC; blue indicates greater alpha/gamma CFC compared to theta/gamma CFC. E) Optimal low (phase) and high (amplitude) frequency bands depend on working memory load. F) The frequency of modulating theta oscillations (frequency for phase) shifts toward lower frequencies with increased working memory load (colored circles indicate values for individual subjects). G) In contrast, there is no change in high frequencies (frequency for amplitude), probably due to high intersubject variability. H) Interestingly, the ratio of high-to-low frequencies remains constant across different load conditions. A and B reproduced with permission from Ref. [43]; C and D reproduced with permission from Ref. [55]; E–H reproduced with permission from Ref. [53].
Figure 2
Figure 2. Low frequency phase is entrained by rhythmic behavioral events
A) From [56], intermodal auditory/visual selective-attention task. Light bulbs and speakers represent visual and auditory stimuli in the mixed stimulus stream. Visual and auditory deviants are marked by light blue and magenta arrows, respectively. Stimulus onset asynchrony (SOA) within modality was jittered around a mean of 650 ms; SOA between modalities had a mean of 300 ms. B) Color maps show current source density (CSD) profiles related to standard visual stimuli in the attend-visual (AV) and attend-auditory (AA) conditions. Red arrowhead indicates the visual event used as trigger (0 ms). C) Current source density (CSD) from a supragranular electrode in the AV and AA conditions. D) Distribution of single-trial supragranular prestimulus (0 ms) delta oscillatory phases in the same experiment. E) Pooled prestimulus mean (across trials) delta phase for all experiments. Reproduced with permission from Ref. [56].
Figure 3
Figure 3. Cross-frequency coupling is dynamic and exhibits fast task- and event-related changes in coupling strength
A) T-maze with task events and run trajectories from a representative session with 39 trials. B) Phase-to-amplitude comodulograms for electrode in the striatum plotted for each task-event window. Pseudocolor scale represents CFC strength; positive values indicate significant phase-to-amplitude CFC. C) As in B, for a hippocampal electrode. Note the difference in onset, duration, and offset times of strong CFC in these two brain areas. Reproduced with permission from Ref. [37].
Figure 4
Figure 4. Hippocampal theta/gamma cross-frequency coupling correlates with learning and task performance
Theta modulation of low gamma (LG) amplitude in the CA3 region during context exploration increases with learning. A) Behavioral profile of a representative rat during learning of the task. Shown is the animal’s performance (correct, black bar up; error, black bar down) at each trial of the session (Upper) and the associated learning curve computed by using a sliding window of 20 trials (Lower). B) Pseudocolor scale representation of the mean CA3 LG amplitude as a function of the theta phase for each trial in the session (Left). The mean LG amplitude per theta phase averaged over the first and last 20 trials is also shown (Right). C) CFC modulation index (MI) curve computed by using a 20-trial sliding window. (D) Linear correlation between theta-LG coupling strength and task performance. The correlation between the MI and learning curves (Left) and the average MI value over each mean performance percentage (Right) are shown. Reproduced with permission from Ref. [39].
Box 2, Figure I
Box 2, Figure I. The hippocampal CA1 region exhibits two distinct gamma bands (y-axis), and both are modulated by the phase of the theta rhythm (x-axis)
Time frequency representations of power for a representative recording, averaged across (i) all theta cycles, (ii) theta cycles with slow gamma, (iii) theta cycles with fast gamma and (iv) the minority of theta cycles exhibiting both slow and fast gamma. v) The averaged unfiltered theta cycle. Reproduced with permission from Ref. [86].

References

    1. Nunez PL, Srinivasan R. Electric fields of the brain: the neurophysics of EEG. Oxford University Press; 2006.
    1. Varela F, Lachaux JP, Rodriguez E, Martinerie J. The brainweb: phase synchronization and large-scale integration. Nat. Rev. Neurosci. 2001;2:229–239. - PubMed
    1. Engel AK, Fries P, Singer W. Dynamic predictions: oscillations and synchrony in top-down processing. Nat. Rev. Neurosci. 2001;2:704–716. - PubMed
    1. Jacobs J, Kahana MJ. Direct brain recordings fuel advances in cognitive electrophysiology. Trends Cogn. Sci. 2010;14:162–171. - PMC - PubMed
    1. Lakatos P, et al. An oscillatory hierarchy controlling neuronal excitability and stimulus processing in the auditory cortex. J. Neurophysiol. 2005;94:1904–1911. - PubMed