. 2010 Nov 5;402(1):116-22.
doi: 10.1016/j.bbrc.2010.09.127. Epub 2010 Oct 12.

CYP2E1 enhances ethanol-induced lipid accumulation but impairs autophagy in HepG2 E47 cells

Affiliations

CYP2E1 enhances ethanol-induced lipid accumulation but impairs autophagy in HepG2 E47 cells

Defeng Wu et al. Biochem Biophys Res Commun. .

Abstract

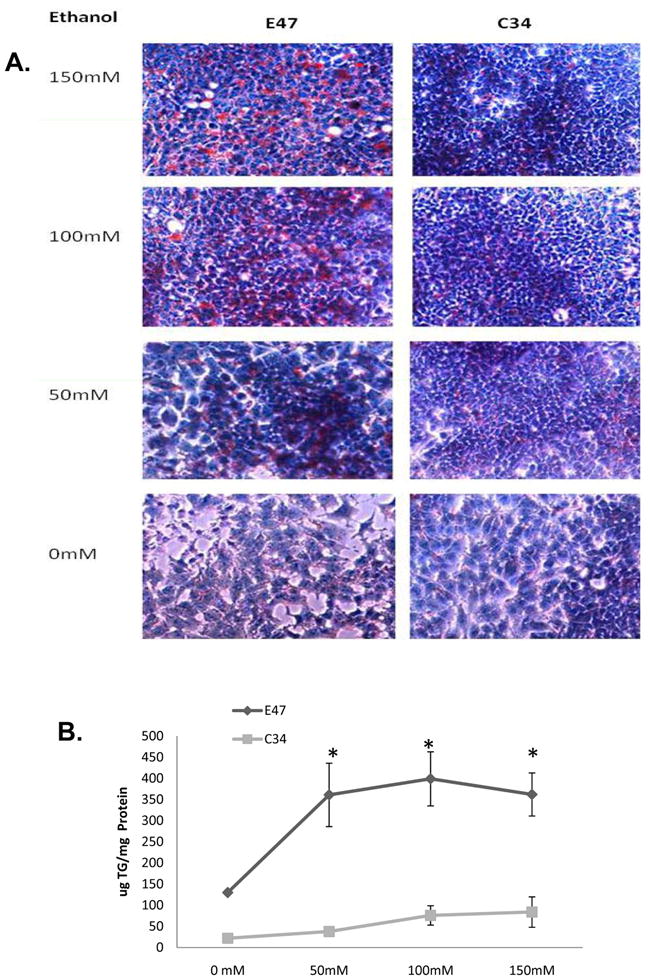
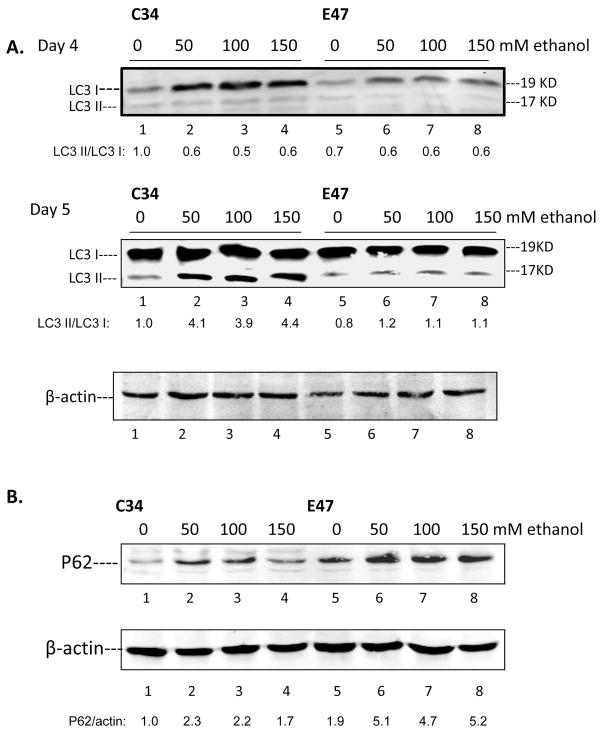
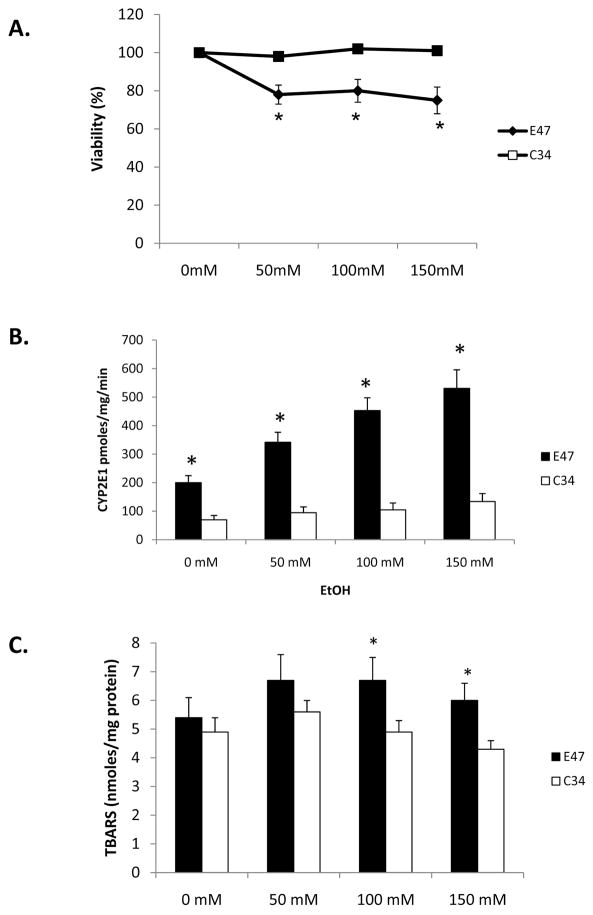
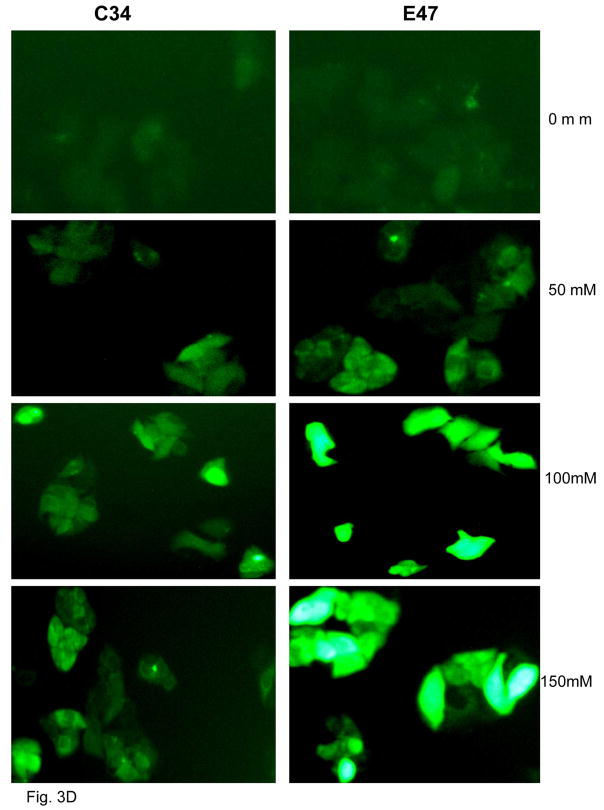
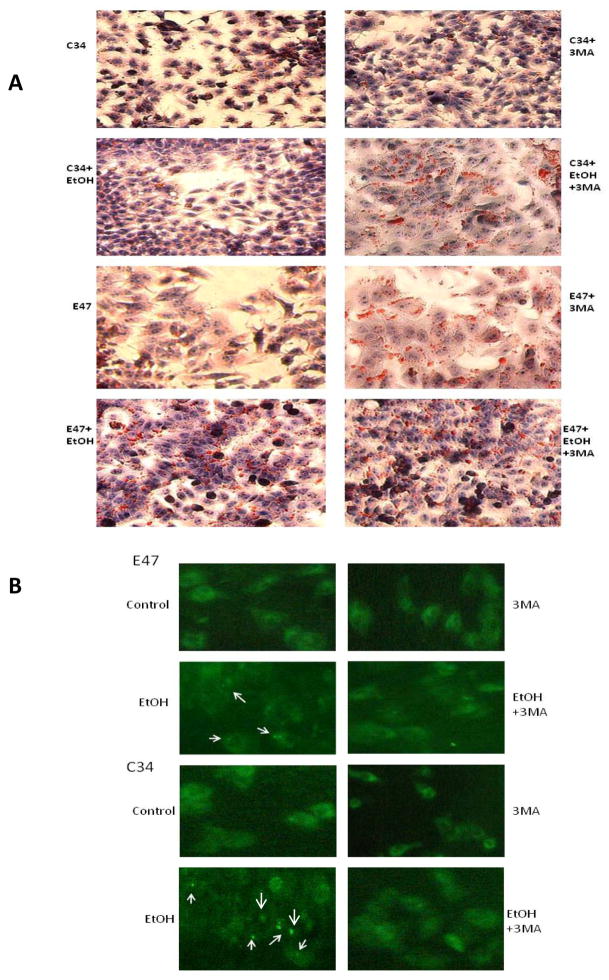
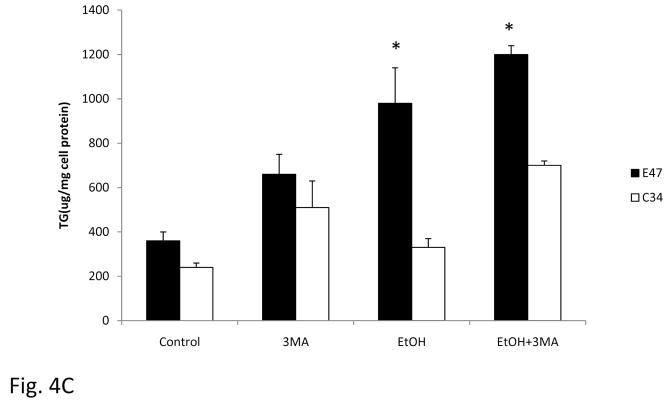
The regulation and function of autophagy and lipid metabolism have recently been reported to be reciprocally related. Macroautophagy mediates the breakdown of lipids stored in lipid droplets. An inhibition of autophagy leads to the development of a fatty liver. We evaluated the ability of CYP2E1 to modulate the effects of ethanol on lipid accumulation and autophagy in vitro. The E47 HepG2 cell which expresses CYP2E1 was treated with ethanol at 50, 100 and 150mM for 4 or 5days. Ethanol-induced lipid accumulation and an increase of triglycerides (TG) in E47 cells to a greater extent than in control C34 cells which do not express CYP2E1. In contrast, autophagy (LC3 II/LC3 I ratio) was significantly induced by ethanol in C34 cells to a greater extent than in E47 cells. P62 was significantly increased in E47 cells after ethanol treatment. Thus, there is a reciprocal relationship between the effects of ethanol on lipid accumulation and autophagy in the CYP2E1-expressing cells. Inhibition of autophagy by 3-methyladenine (3MA), increased lipid accumulation and TG levels in C34 cells which display elevated autophagy, but enhanced lipid accumulation and TG level to a lesser extent in E47 cells which displayed lower autophagy. Ethanol induced CYP2E1 activity and oxidative stress in E47 cells compared with C34 cells. These experiments suggest that the expression of CYP2E1 may impair autophagy formation which contributes to lipid accumulation in the liver. We hypothesize that CYP2E1-induced oxidative stress promotes the accumulation of lipid droplets by ethanol and this may be responsible for the suppression of autophagy in the liver.


Figures

Fig. 1
Fig. 1. Ethanol induces steatosis in E47 but not C34 cells
E47 and C34 cells were treated with ethanol at concentrations of 0, 50, 100 and 150 mM, respectively for 5 days in a humidity atmosphere which was saturated with a 50 mM ethanol solution. Oil Red O Staining (A) was carried out to evaluate the accumulation of lipid droplets. The TG levels (B) in the cell lysate were determined, and results represented as ug/mg cell lysate protein. Results reflect mean±SD and are from three experiments. * P<0.05, compared with C34 cells.
Fig. 2
Fig. 2. Ethanol induced autophagy is enhanced in C34 cells to a greater extent than in E47 cells
E47 and C34 cells were treated with 50–150 mM ethanol for 4 or 5 days. Cell lysates were prepared and immunoblots were carried out to determine the levels of the autophagy marker LC3 I and LC3II (A). Bands of LC3 I and II were scanned and the LC3 II/LC3 I ratio determined. P62 levels in E47 and C34 cells (B) were determined by immunoblot with a polyclonal antibody. The P62/β-actin ratio is shown below the blot.
Fig. 3
Fig. 3. Effects of Ethanol on CYP2E1 activity, ROS stress and cellular viability
E47 and C34 cells were treated with 50–150 mM ethanol for 5 days. MTT assay was carried out to determine cell viability. P<0.05, E47 cells compared to C34 cells (A). CYP2E1 activity was analyzed by determining the oxidation of para-nitrophenol, and results are presented as pmoles/min/mg microsomal protein P< 0.05, E47 cells compared to C34 cells (B). Lipid peroxidation was evaluated by determining the production of malondialdehyde (nmoles/mg cellular protein) (C) by the TBARS assay. Results are from three experiments. P<0.05, E47 cells compared to C34 cells. E47 and C34 cells were treated with ethanol for 5 days and ROS was detected with a fluorescence Total ROS Detection Kit (D). Fifteen different fields in each plate were observed under the fluorescence microscope to determine the fluorescence intensity.
Fig. 4
Fig. 4. Inhibition of autophagy promotes lipid accumulation in C34 and E47 cells
E47 and C34 cells were treated with 100 mM ethanol or ethanol plus 3MA (10 mM) for 5 days. Oil Red O Staining was carried out to evaluate the accumulation of lipid droplets (A). The inhibition of autophagy by 3MA was determined with an immunofluorescence method which detects LC3 in the cellular cytosol. The arrows indicate the positive stained autophagy in the cells (B). The contents of TG after ethanol or ethanol plus 3MA treatment (C). * Significantly different P<0.05 compared with C34 cells (n=6).

References

    1. Lieber CS. Alcoholic fatty liver: its pathogenesis and mechanism of progression to inflammation and fibrosis. Alcohol. 2004;34(1):9–19. - PubMed
    1. Cederbaum AI, Lu Y, Wu D. Role of oxidative stress in alcohol-induced liver injury. Arch Toxicol. 2009;83:519–548. - PubMed
    1. Wu D, Cederbaum AI. Alcohol, oxidative stress and free radical damage. Alcohol Research & Health. 2003;27(4):277–284. - PMC - PubMed
    1. Cederbaum AI. Microsomal generation of reactive oxygen species and their possible role in alcohol hepatotoxicity. Alcohol alcohol. 1991;(Suppl 1):291–296. - PubMed
    1. Guengerich FP. Oxidative cleavage of carboxylic esters by cytochrome p-450. J Biol Chem. 1987;262:8459–8462. - PubMed

Publication types

LinkOut - more resources