. 2011 Jan 10;102(1):84-90.
doi: 10.1016/j.physbeh.2010.09.024.

Chronic stress, energy balance and adiposity in female rats

Affiliations

Chronic stress, energy balance and adiposity in female rats

Matia B Solomon et al. Physiol Behav. .

Abstract

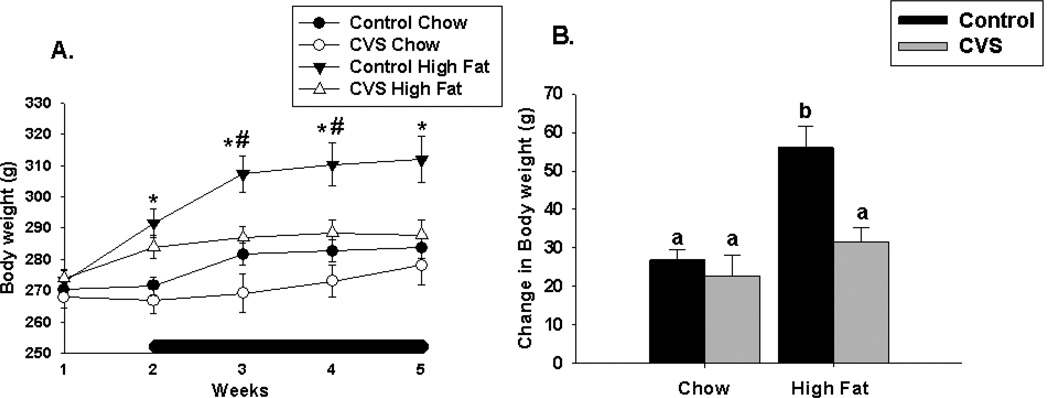
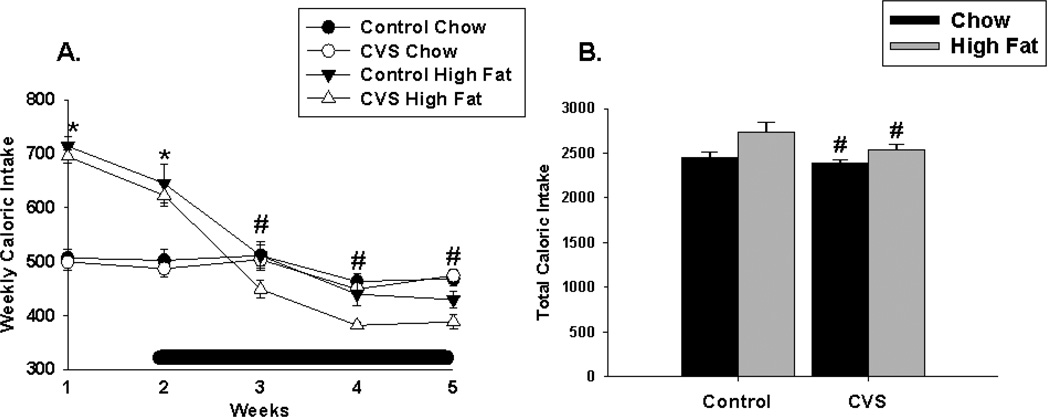
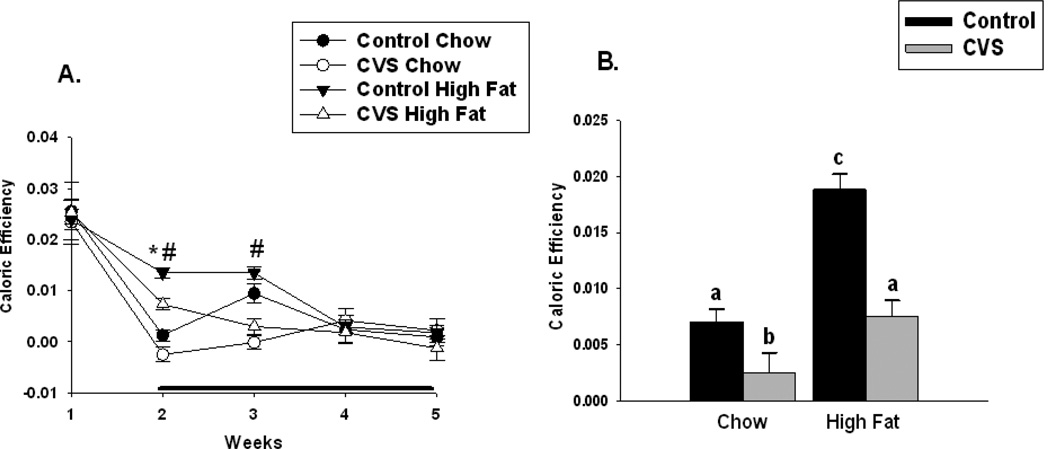
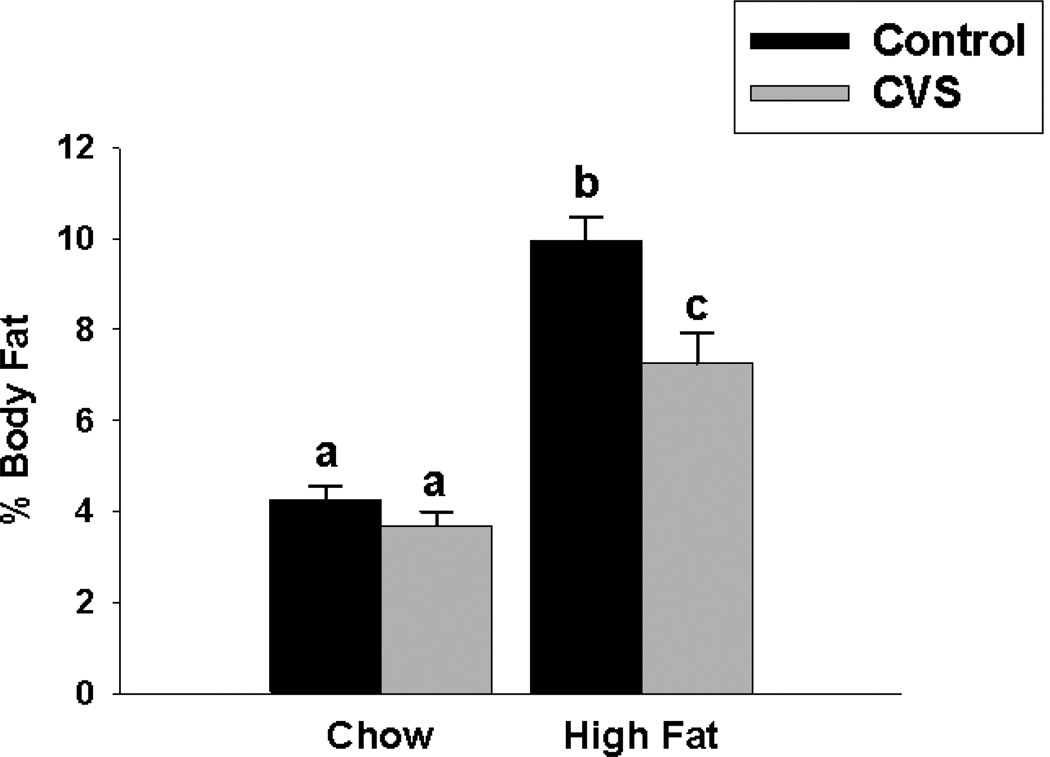
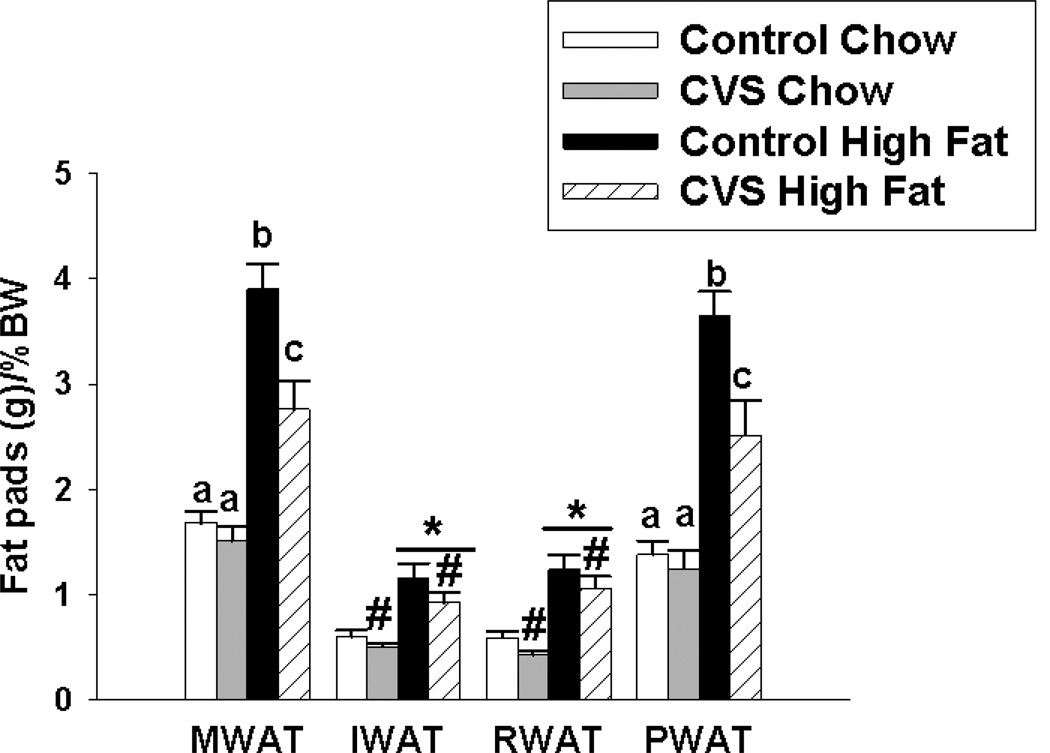
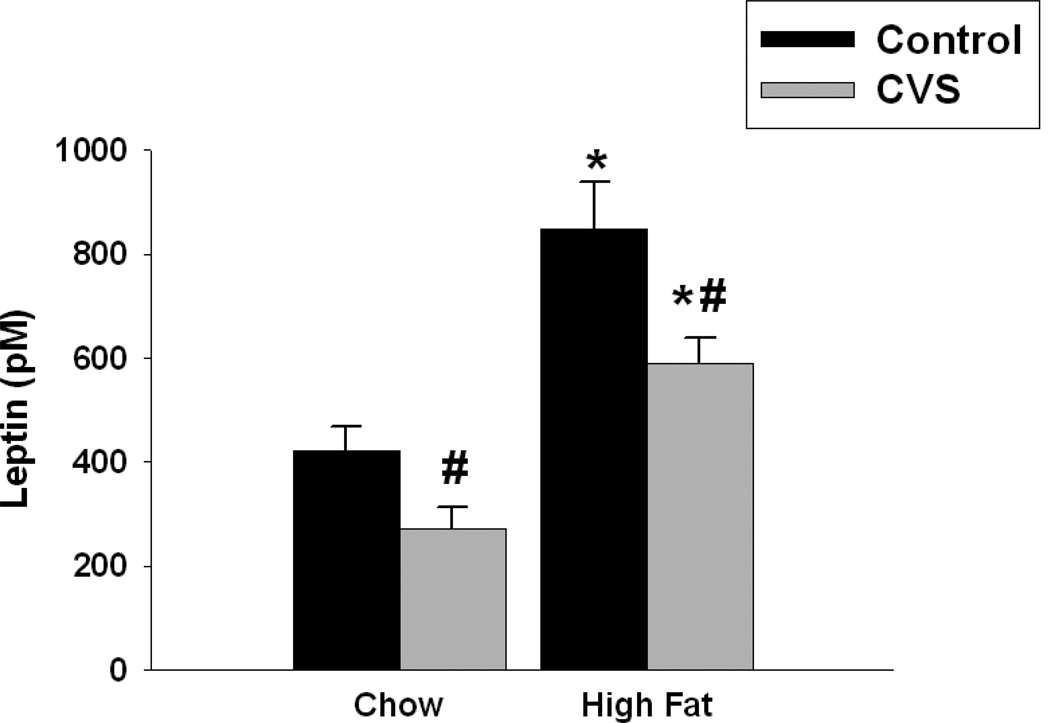
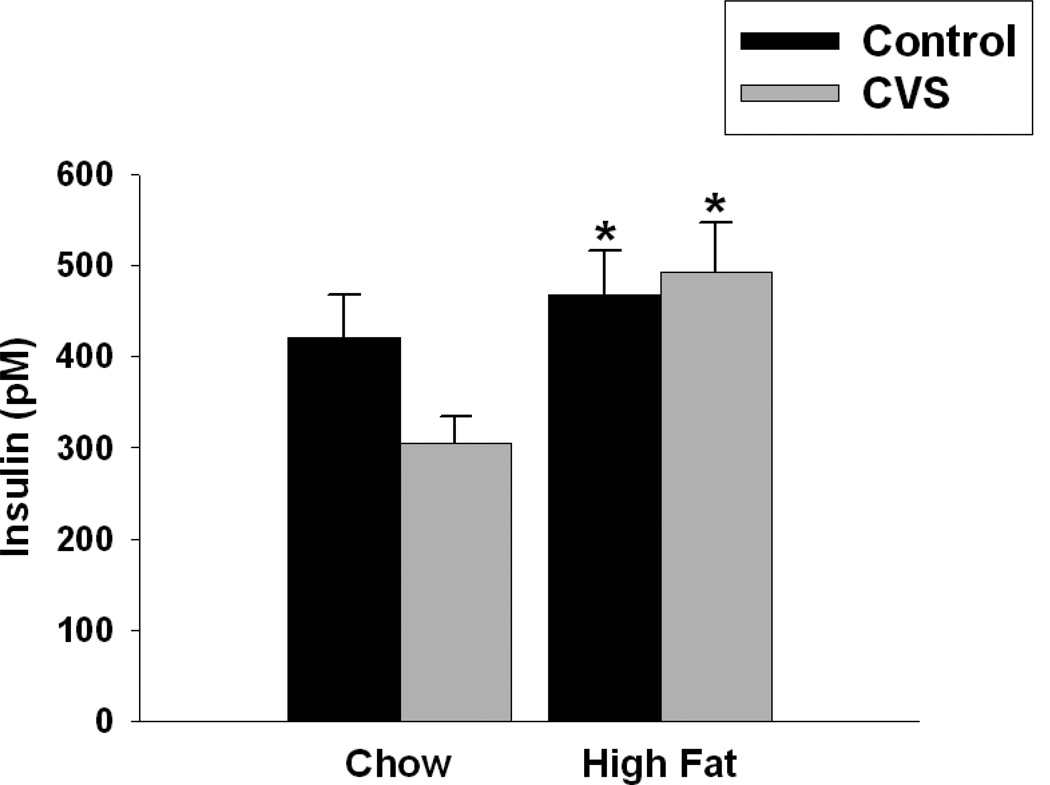
Stress preferentially increases the consumption of high fat foods in women, suggesting the interaction of these two factors may disproportionately predispose women toward excess weight gain. In the present study, female rats were exposed to a chronic high fat or chow diet and were exposed to 4weeks of chronic variable stress (CVS) or served as home cage controls. Control females exposed to a high fat diet displayed many symptoms of the metabolic syndrome including increased body weight gain, total and visceral adiposity and insulin and leptin concentrations relative to all groups. However, CVS-high fat, CVS chow and control chow groups had similar body weight gain and caloric efficiency. This finding suggests that CVS increases energy expenditure much more in females exposed to a high fat diet relative to those fed a standard chow diet. The CVS-high fat group had increased adiposity and increased circulating leptin and insulin concentrations, despite the fact that their body weight did not differ from the controls. These results underscore the importance of assessing the degree of adiposity, rather than body weight alone, as an index of overall metabolic health. Overall, the data indicate that in female rats, chronic stress prevents high fat diet related increases in body weight, but does not prevent high fat diet induced increases in adiposity when compared to chow-fed females.


Figures

Figure 1
Figure 1
Effects of CVS and diet on body weight gain in female rats. (A) Females fed a chronic high fat diet had increased body weight regardless of CVS exposure relative to their chow fed counterparts at weeks 2–5. CVS, regardless of diet, significantly decreased body weight at weeks 2 and 3 relative to the control group. (B) Overall, control high fat fed females gained significantly more weight relative to all other groups. There was no significant difference in overall bodyweight gain among the remaining groups. Black bar indicates stress period. Values represent mean ± SEM, n= 9–10 per group. *, # indicates significant effect of high fat diet and CVS, respectively. Non-shared letters denote statistical significance. Statistical significance is ascribed at p ≤0.05.
Figure 2
Figure 2
Effects of CVS and diet on caloric intake in female rats. (A) High-fat fed females consumed significantly more calories during the first week relative to their chow-fed counterparts at weeks 1 and 2. However, by weeks 4 and 5, females exposed to chronic high fat diet consumed significantly fewer calories relative to females exposed to chow. (B) Overall, CVS significantly decreased total caloric intake. Black bar indicates stress period. Values represent mean ± SEM, n= 9–10 per group. *, # indicates significant main effect of high fat diet and CVS, respectively. Statistical significance is ascribed at p ≤0. 05.
Figure 3
Figure 3
Effects of CVS and diet on weekly and overall caloric efficiency in female rats. Caloric efficiency was calculated by dividing the total body weight gained by the total calories consumed. (A) At week 2, high fat fed females had greater caloric efficiency compared with chow-fed females, while CVS females at weeks 2 and 3 were less calorically efficient compared with control females. (B) Control high-fat fed females had increased overall caloric efficiency relative to all other groups. CVS chow-fed females had decreased caloric efficiency relative to the control chow-fed females. There was no difference in caloric efficiency between the CVS high-fat fed females and the control chow females. Black bar indicates stress period. Values represent mean ± SEM, n= 9–10 per group. *, # indicates significant main effect of high fat diet and CVS, respectively. Non-shared letters denote statistical significance. Statistical significance is ascribed at p ≤0. 05.
Figure 4
Figure 4
Effects of CVS and diet on % body fat in female rats. Control high-fat fed females had significantly more body fat relative to all other groups. CVS high-fat fed females had significantly more body fat relative to the chow fed females. There was no difference in body fat between CVS chow and control chow groups. Values represent mean ± SEM, n= 9–10 per group. Non-shared letters denote statistical significance. Statistical significance is ascribed at p ≤0.05.
Figure 5
Figure 5
Effects of CVS and diet on individual % fat pad depots in female rats. Control high-fat fed females had significantly more MWAT and PWAT relative to all other groups. CVS high-fat fed females had significantly more MWAT relative to the chow fed females. There was no difference in MWAT weight between CVS chow and control chow groups. High-fat fed females had significantly increased IWAT relative to the chow group. Regardless of diet, CVS significantly decreased RWAT relative to the control group. In addition, high fat diet regardless of CVS exposure, significantly increased RWAT. Values represent mean ± SEM, n= 9–10 per group. *, # indicates significant main effect of high fat diet and CVS, respectively. Non-shared letters denote statistical significance. Statistical significance is ascribed at p ≤0.05.
Figure 6
Figure 6
Effects of CVS and diet on leptin concentrations in female rats. High fat diet, regardless of CVS significantly increased leptin concentrations. Likewise, CVS regardless of diet significantly decreased leptin concentrations. Values represent mean ± SEM, n= 8–10 per group. *, # indicates significant main effect of high fat diet and CVS, respectively. Statistical significance is ascribed at p ≤0.05.
Figure 7
Figure 7
Effects of CVS and diet on insulin concentrations in female rats. High fat diet regardless of CVS significantly increased insulin concentrations. Values represent mean ± SEM, n= 8–10 per group. * indicates significant main effect of high fat diet. Statistical significance is ascribed at p ≤0.05.

References

    1. Kyrou I, Tsigos C. Stress hormones: physiological stress and regulation of metabolism. Curr Opin Pharmacol. 2009;9(6):787–793. - PubMed
    1. Wajchenberg BL, et al. Estimation of body fat and lean tissue distribution by dual energy X-ray absorptiometry and abdominal body fat evaluation by computed tomography in Cushing's disease. J Clin Endocrinol Metab. 1995;80(9):2791–2794. - PubMed
    1. Shively CA, Clarkson TB. Regional obesity and coronary artery atherosclerosis in females: a non-human primate model. Acta Med Scand Suppl. 1988;723:71–78. - PubMed
    1. Foster MT, et al. Social defeat increases food intake, body mass, and adiposity in Syrian hamsters. Am J Physiol Regul Integr Comp Physiol. 2006;290(5):R1284–R1293. - PubMed
    1. Solomon MB, et al. Social defeat and footshock increase body mass and adiposity in male Syrian hamsters. Am J Physiol Regul Integr Comp Physiol. 2007;292(1):R283–R290. - PubMed

Publication types