

Modeling Sjögren's syndrome with Id3 conditional knockout mice
- PMID: 20932862
- PMCID: PMC3025308
- DOI: 10.1016/j.imlet.2010.09.009
Modeling Sjögren's syndrome with Id3 conditional knockout mice
Abstract
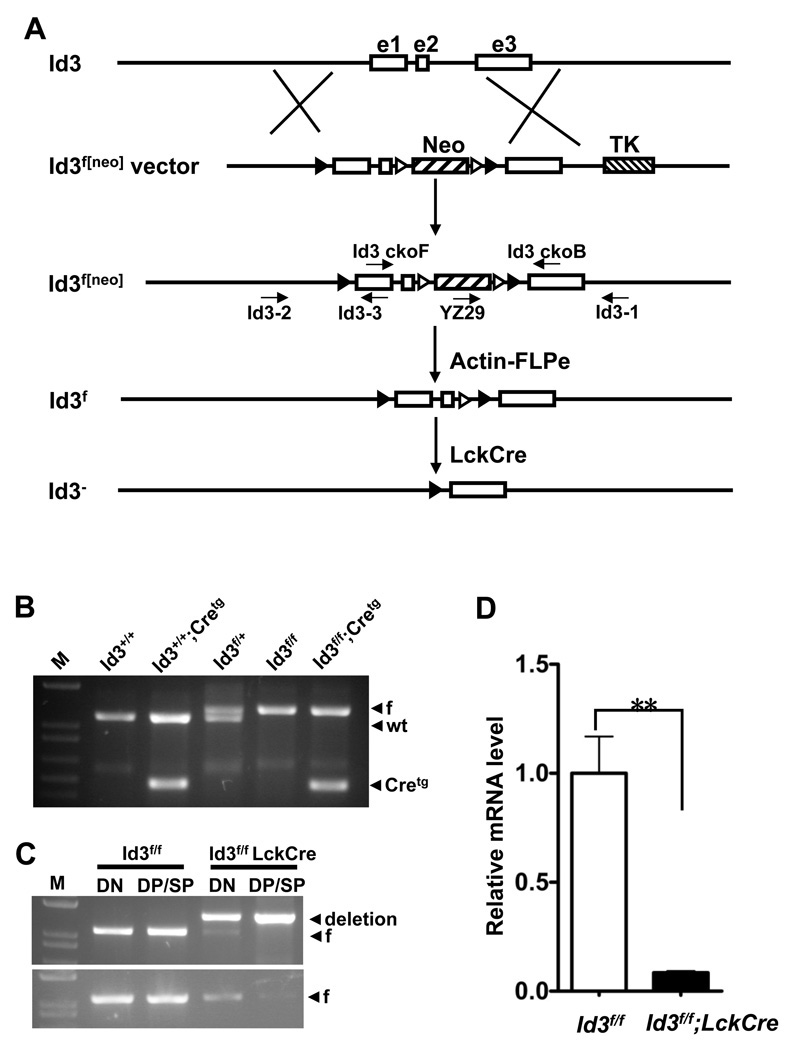
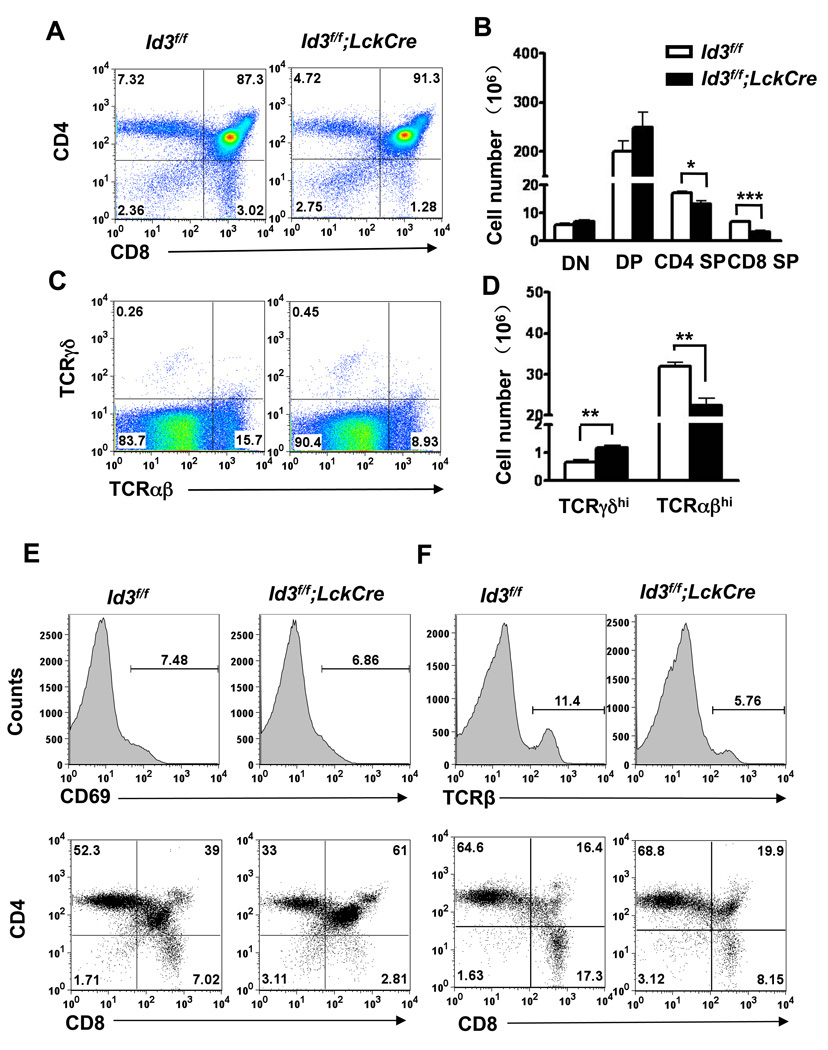
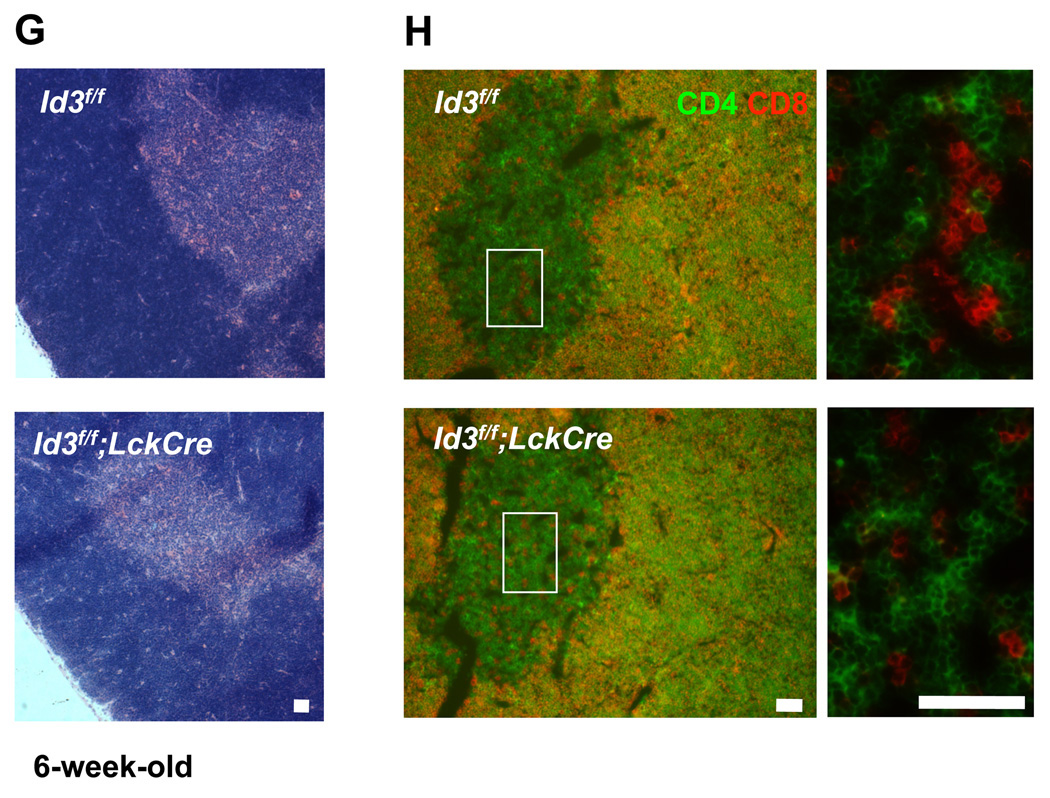
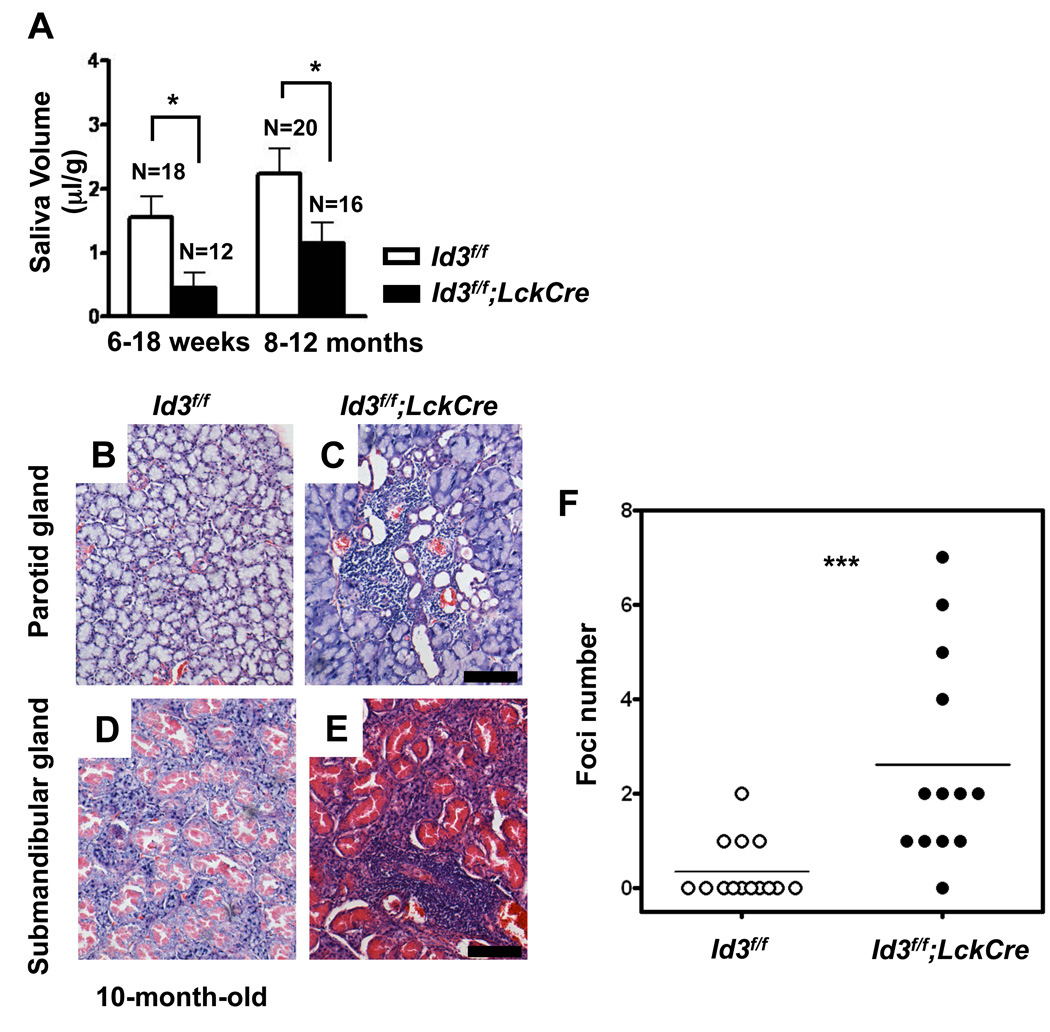
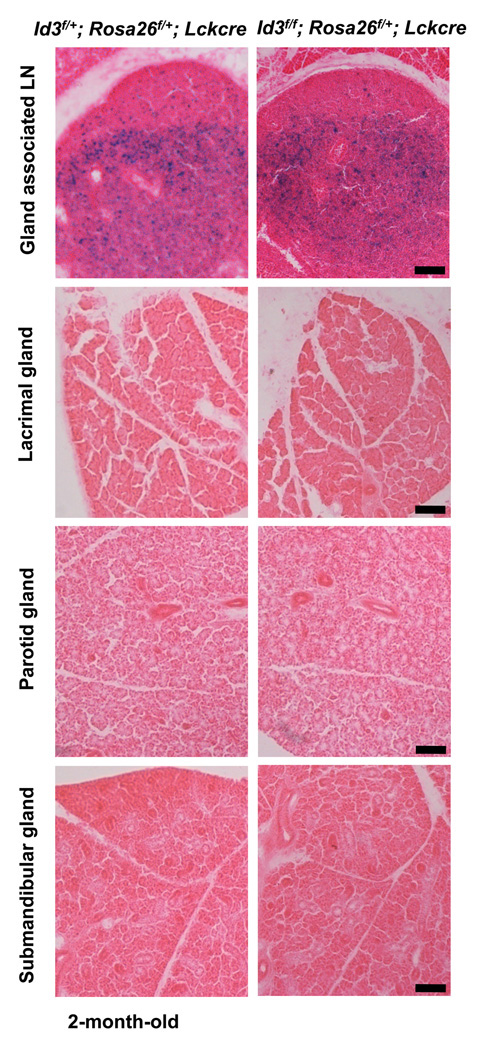
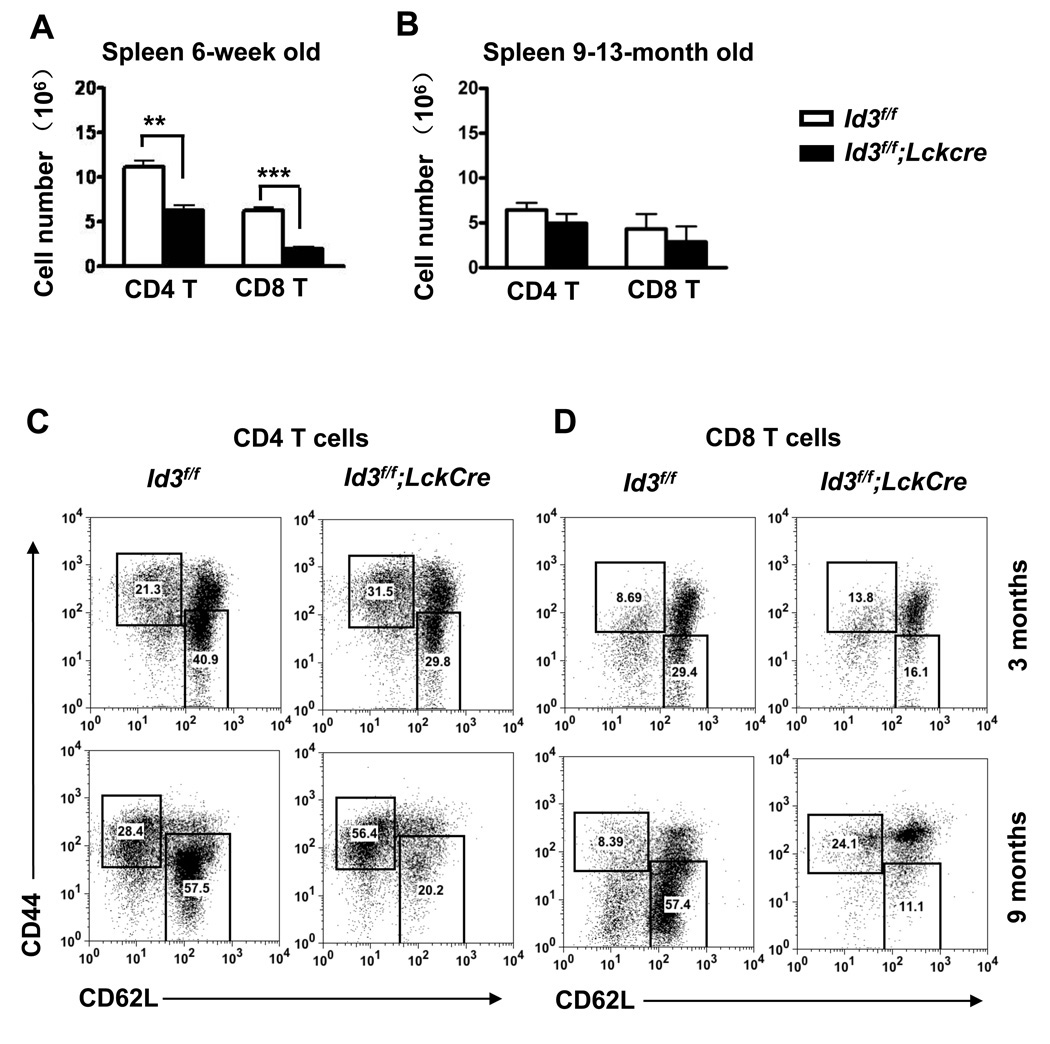
The Id3 gene has been shown to play important roles in the development and function of broad tissue types including B and T cells. Id3 deficient mice develop autoimmune disease similar to human Sjögren's syndrome. Both B and T lymphocytes have been implicated to contribute to the disease phenotype in this disease model. In order to gain a better understanding of individual cell types in this disease model, we generated an Id3 conditional allele. An LckCre transgene was used to induce Id3 deletion in developing T cells. We showed that the Id3 gene was efficiently disrupted in early thymocyte development prior to T cell receptor (TCR)-mediated positive selection. Consequently, thymocyte maturation was impaired in the conditional knockout mice. These mice developed exocrinopathy starting at two months of age and subsequently exhibited high incidence of lymphocyte infiltration to salivary glands between eight and 12 months of age. This progressive feature of disease development is very similar to those observed in Id3 germline knockout mice. This study establishes a new model for investigating the relationship between T cell development and autoimmune disease. Our observation provides an experimental case that autoimmune disease may be induced by acquired mutation in developing T cells.
Copyright © 2010 Elsevier B.V. All rights reserved.
Figures
Similar articles
-
B-lymphocyte depletion ameliorates Sjögren's syndrome in Id3 knockout mice.Immunology. 2007 Sep;122(1):73-9. doi: 10.1111/j.1365-2567.2007.02614.x. Epub 2007 Apr 30. Immunology. 2007. PMID: 17472721 Free PMC article.
-
Contribution of IL-13 to early exocrinopathy in Id3-/- mice.Mol Immunol. 2011 Oct;49(1-2):227-33. doi: 10.1016/j.molimm.2011.08.012. Epub 2011 Sep 14. Mol Immunol. 2011. PMID: 21924496 Free PMC article.
-
A T cell intrinsic role of Id3 in a mouse model for primary Sjogren's syndrome.Immunity. 2004 Oct;21(4):551-60. doi: 10.1016/j.immuni.2004.08.013. Immunity. 2004. PMID: 15485632
-
Pathogenesis of Sjögren's syndrome-like autoimmune lesions in MRL/lpr mice.Pathol Int. 1994 Aug;44(8):559-68. doi: 10.1111/j.1440-1827.1994.tb01716.x. Pathol Int. 1994. PMID: 7952145 Review.
-
The important role of T cells and receptor expression in Sjögren's syndrome.Scand J Immunol. 2013 Aug;78(2):157-66. doi: 10.1111/sji.12079. Scand J Immunol. 2013. PMID: 23679844 Free PMC article. Review.
Cited by
-
Animal models in autoimmune diseases: lessons learned from mouse models for Sjögren's syndrome.Clin Rev Allergy Immunol. 2012 Feb;42(1):35-44. doi: 10.1007/s12016-011-8288-5. Clin Rev Allergy Immunol. 2012. PMID: 22105703 Free PMC article. Review.
-
Mouse Models of Primary Sjogren's Syndrome.Curr Pharm Des. 2015;21(18):2350-64. doi: 10.2174/1381612821666150316120024. Curr Pharm Des. 2015. PMID: 25777752 Free PMC article. Review.
-
Id3 Orchestrates Germinal Center B Cell Development.Mol Cell Biol. 2016 Sep 26;36(20):2543-52. doi: 10.1128/MCB.00150-16. Print 2016 Oct 15. Mol Cell Biol. 2016. PMID: 27457619 Free PMC article.
-
Heterogenous Populations of Tissue-Resident CD8+ T Cells Are Generated in Response to Infection and Malignancy.Immunity. 2020 May 19;52(5):808-824.e7. doi: 10.1016/j.immuni.2020.04.007. Immunity. 2020. PMID: 32433949 Free PMC article.
-
Id proteins synchronize stemness and anchorage to the niche of neural stem cells.Nat Cell Biol. 2012 Apr 22;14(5):477-87. doi: 10.1038/ncb2490. Nat Cell Biol. 2012. PMID: 22522171 Free PMC article.
References
-
- Starr TK, Jameson SC, Hogquist KA. Positive and negative selection of T cells. Annu Rev Immunol. 2003;21:139–176. - PubMed
-
- von Boehmer H, Kisielow P. Negative selection of the T-cell repertoire: where and when does it occur? Immunol Rev. 2006;209:284–289. - PubMed
-
- Bain G, Cravatt CB, Loomans C, Alberola-Ila J, Hedrick SM, Murre C. Regulation of the helix-loop-helix proteins, E2A and Id3, by the Ras-ERK MAPK cascade. Nat Immunol. 2001;2:165–171. - PubMed
-
- Quong MW, Romanow WJ, Murre C. E protein function in lymphocyte development. Annu Rev Immunol. 2002;20:301–322. - PubMed
-
- Lazorchak A, Jones ME, Zhuang Y. New insights into E-protein function in lymphocyte development. Trends Immunol. 2005;26:334–338. - PubMed
Publication types
MeSH terms
Substances
Grants and funding
LinkOut - more resources
Full Text Sources
Medical
Molecular Biology Databases
Research Materials
