

Multisite reliability of cognitive BOLD data
- PMID: 20932915
- PMCID: PMC3009557
- DOI: 10.1016/j.neuroimage.2010.09.076
Multisite reliability of cognitive BOLD data
Abstract
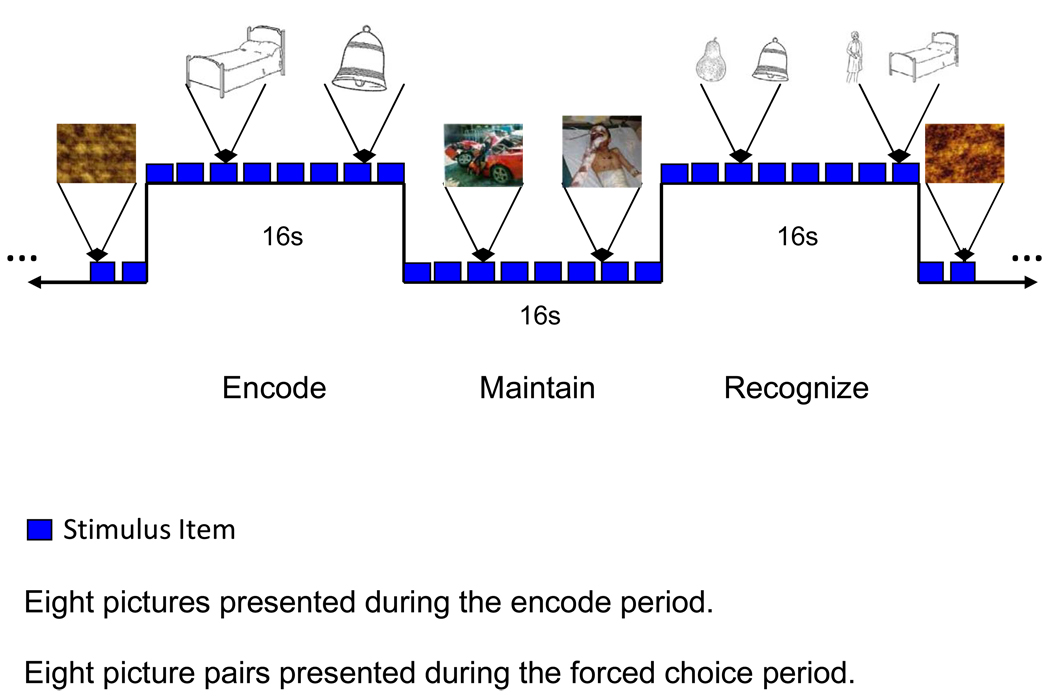
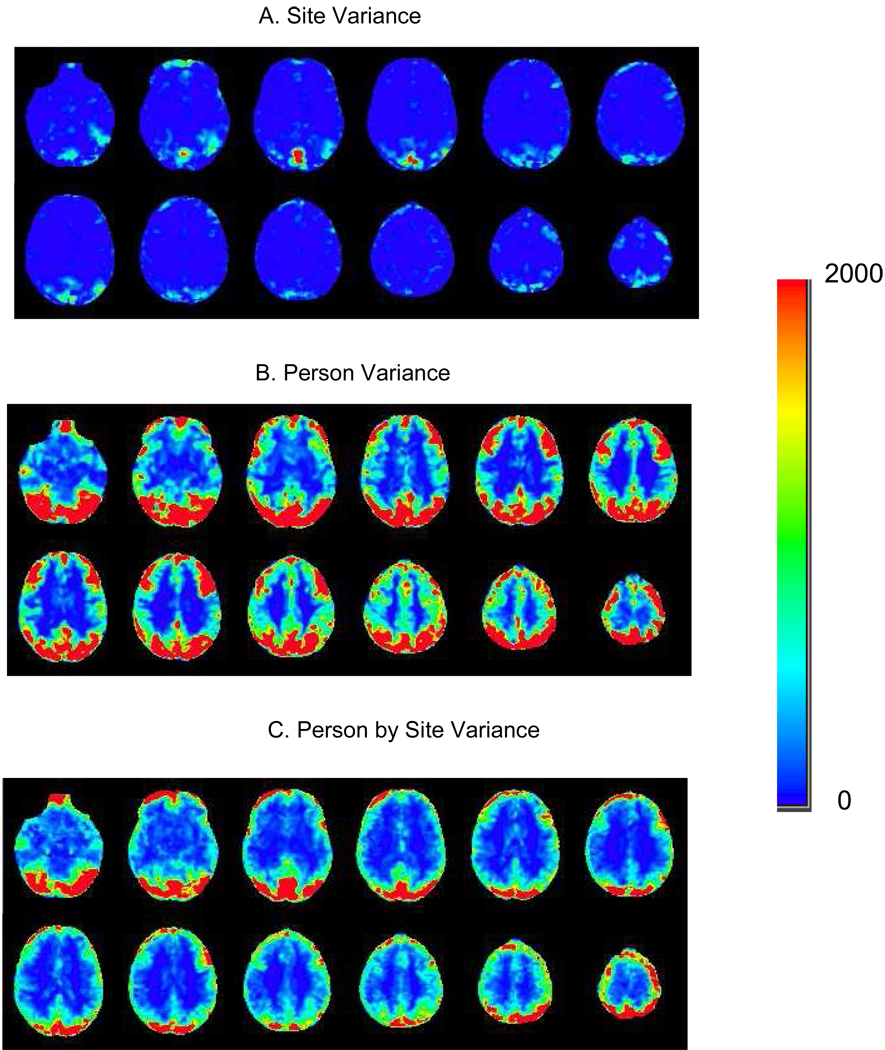
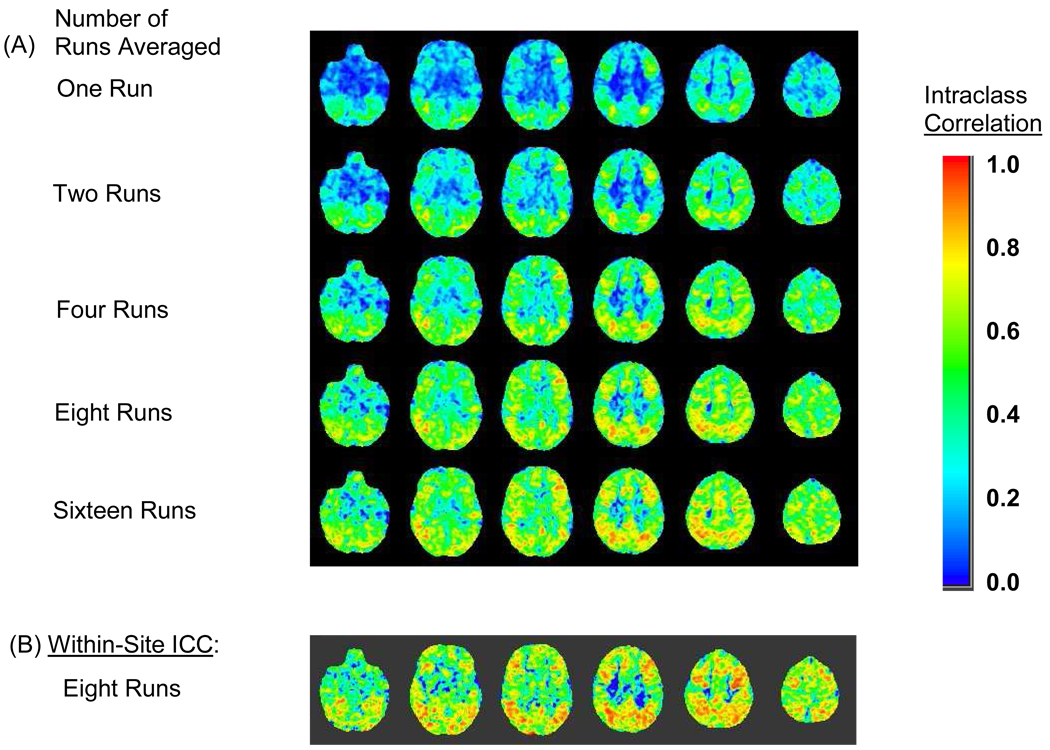
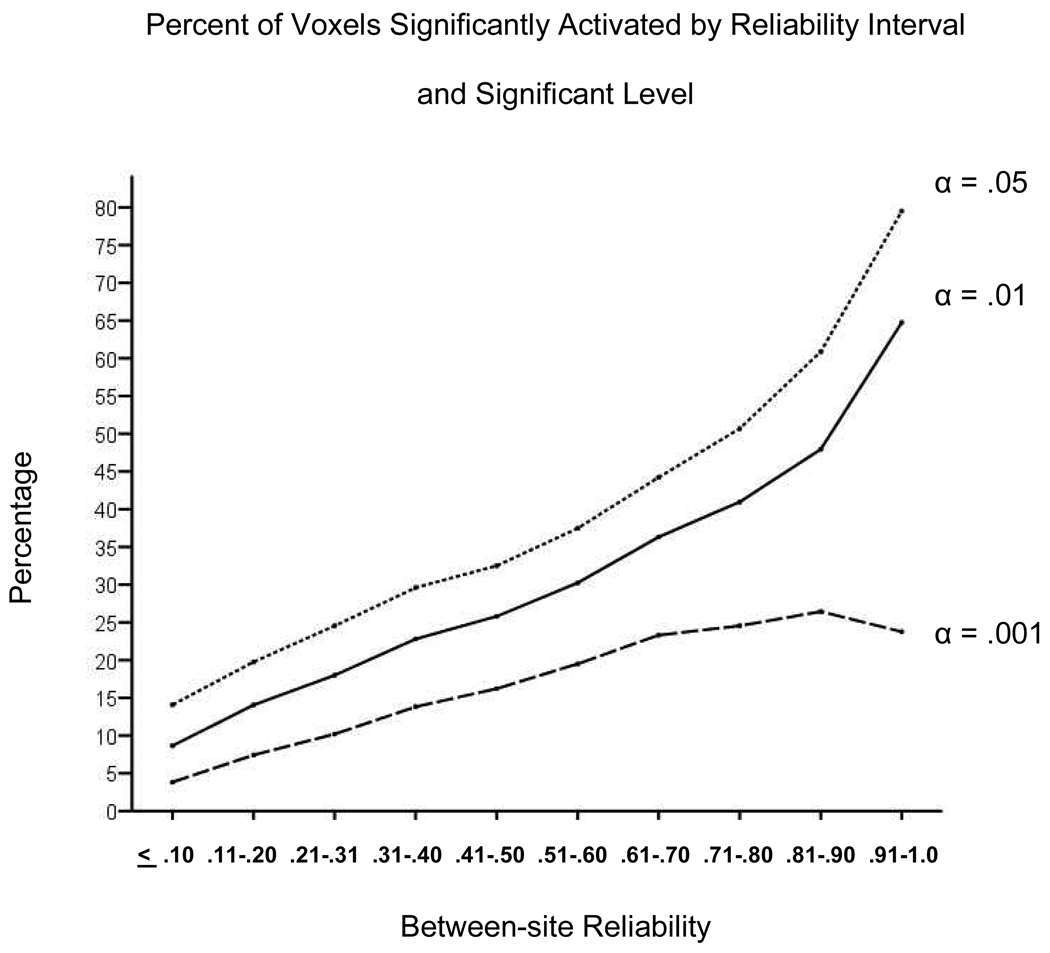
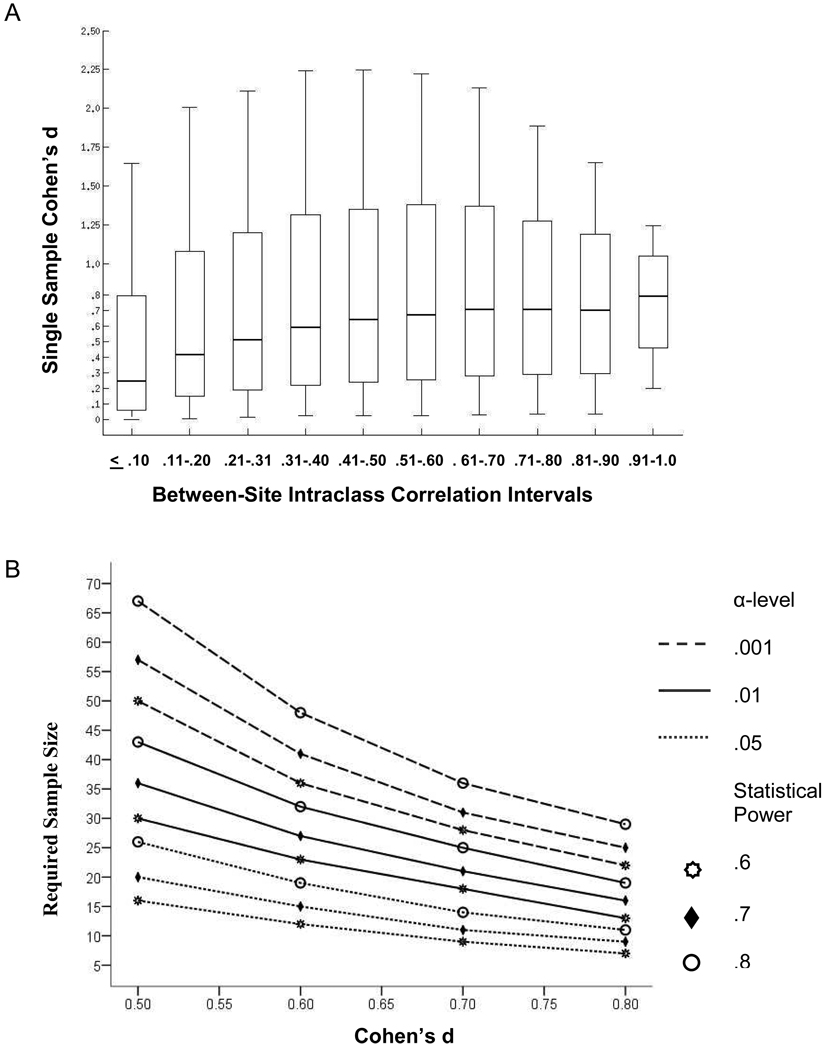
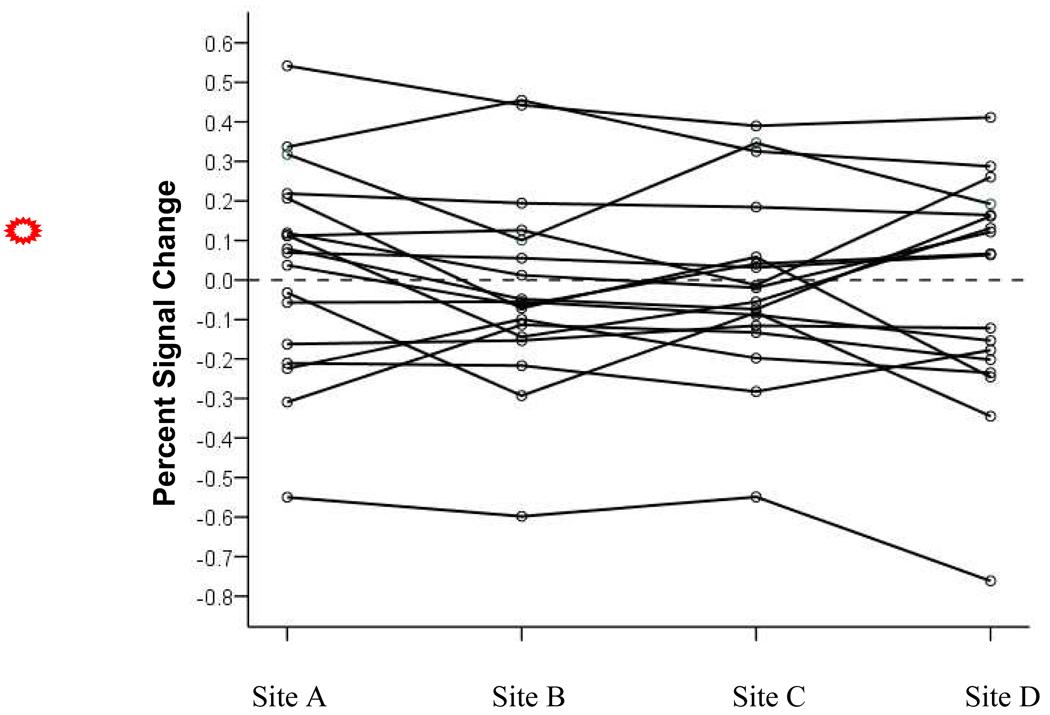
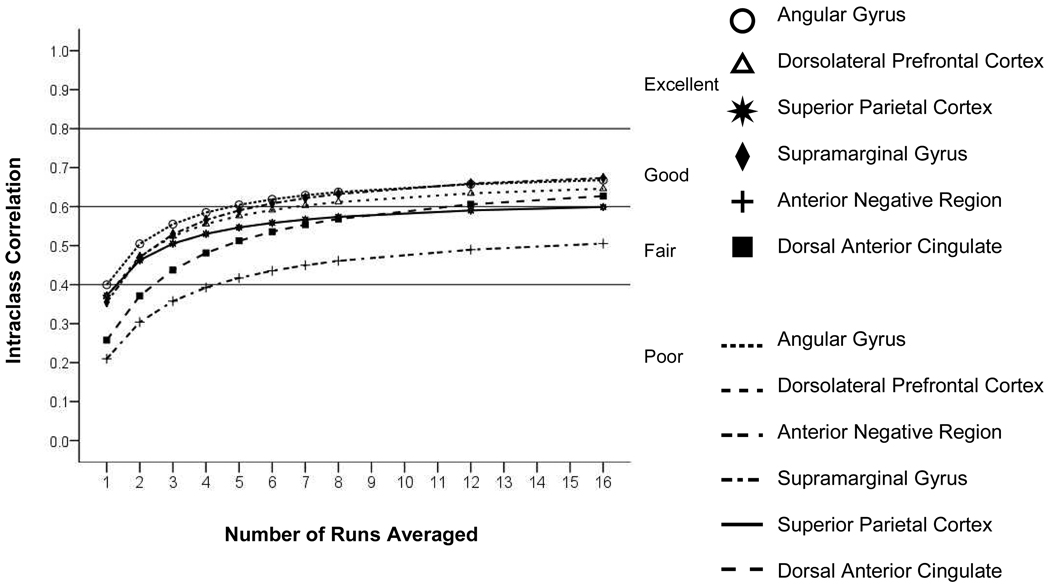
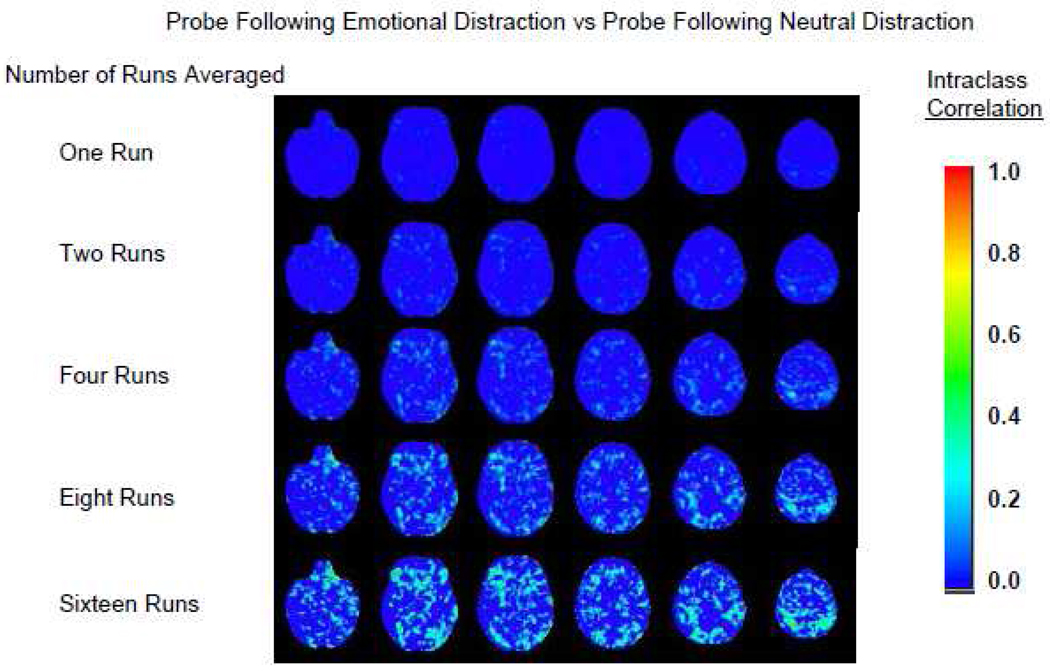
Investigators perform multi-site functional magnetic resonance imaging studies to increase statistical power, to enhance generalizability, and to improve the likelihood of sampling relevant subgroups. Yet undesired site variation in imaging methods could off-set these potential advantages. We used variance components analysis to investigate sources of variation in the blood oxygen level-dependent (BOLD) signal across four 3-T magnets in voxelwise and region-of-interest (ROI) analyses. Eighteen participants traveled to four magnet sites to complete eight runs of a working memory task involving emotional or neutral distraction. Person variance was more than 10 times larger than site variance for five of six ROIs studied. Person-by-site interactions, however, contributed sizable unwanted variance to the total. Averaging over runs increased between-site reliability, with many voxels showing good to excellent between-site reliability when eight runs were averaged and regions of interest showing fair to good reliability. Between-site reliability depended on the specific functional contrast analyzed in addition to the number of runs averaged. Although median effect size was correlated with between-site reliability, dissociations were observed for many voxels. Brain regions where the pooled effect size was large but between-site reliability was poor were associated with reduced individual differences. Brain regions where the pooled effect size was small but between-site reliability was excellent were associated with a balance of participants who displayed consistently positive or consistently negative BOLD responses. Although between-site reliability of BOLD data can be good to excellent, acquiring highly reliable data requires robust activation paradigms, ongoing quality assurance, and careful experimental control.
Published by Elsevier Inc.
Figures
References
-
- Beckmann CF, Jenkinson M, Smith SM. General multilevel linear modeling for group analysis in FMRI. Neuroimage. 2003;20(2):1052–1063. - PubMed
-
- Blair J, Spreen O. Predicting premorbid IQ: a revison of the natinal adult reading test. The clinical neuropsychologist. 1989;3:129–136.
-
- Bosnell R, Wegner C, Kincses ZT, Korteweg T, Agosta F, Ciccarelli O, De Stefano N, Gass A, Hirsch J, Johansen-Berg H, et al. Reproducibility of fMRI in the clinical setting: implications for trial designs. Neuroimage. 2008;42(2):603–610. - PubMed
-
- Brennan RL. Generalizability Theory. New York: Springer-Verlag; 2001.
-
- Caceres A, Hall DL, Zelaya FO, Williams SC, Mehta MA. Measuring fMRI reliability with the intra-class correlation coefficient. Neuroimage. 2009;45(3):758–768. - PubMed
MeSH terms
Substances
Grants and funding
LinkOut - more resources
Full Text Sources
Medical
