

Visual deficits in anisometropia
- PMID: 20932989
- PMCID: PMC3010510
- DOI: 10.1016/j.visres.2010.09.029
Visual deficits in anisometropia
Abstract
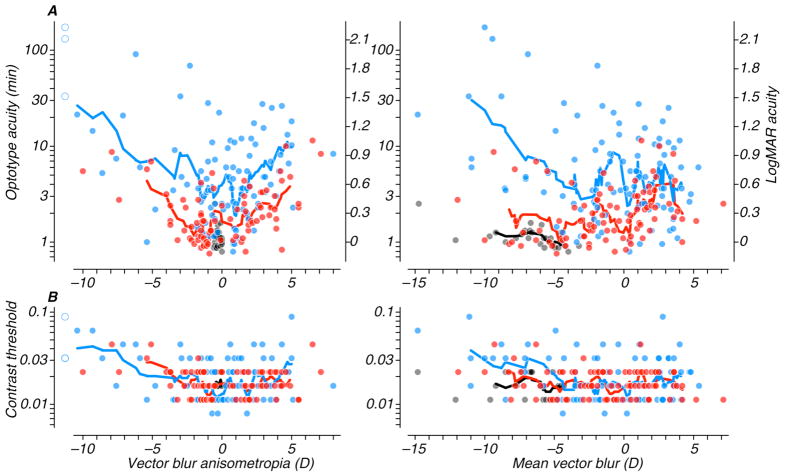
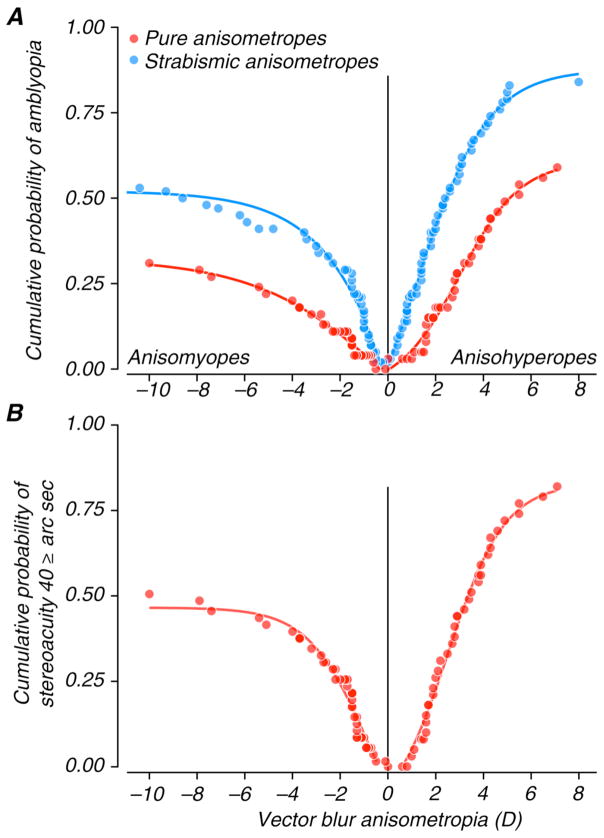
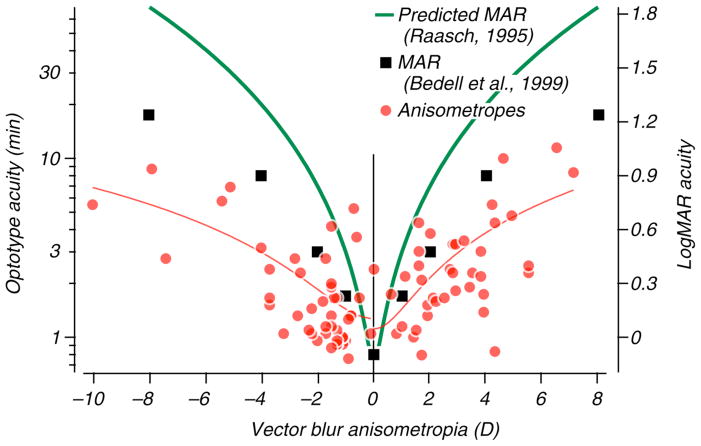
Amblyopia is usually associated with the presence of anisometropia, strabismus or both early in life. We set out to explore quantitative relationships between the degree of anisometropia and the loss of visual function, and to examine how the presence of strabismus affects visual function in observers with anisometropia. We measured optotype acuity, Pelli-Robson contrast sensitivity and stereoacuity in 84 persons with anisometropia and compared their results with those of 27 persons with high bilateral refractive error (isoametropia) and 101 persons with both strabismus and anisometropia. All subjects participated in a large-scale study of amblyopia (McKee et al., 2003). We found no consistent visual abnormalities in the strong eye, and therefore report only on vision in the weaker, defined as the eye with lower acuity. LogMAR acuity falls off markedly with increasing anisometropia in non-strabismic anisometropes, while contrast sensitivity is much less affected. Acuity degrades rapidly with increases in both hyperopic and myopic anisometropia, but the risk of amblyopia is about twice as great in hyperopic than myopic anisometropes of comparable refractive imbalance. For a given degree of refractive imbalance, strabismic anisometropes perform considerably worse than anisometropes without strabismus--visual acuity for strabismics was on average 2.5 times worse than for non-strabismics with similar anisometropia. For observers with equal refractive error in the two eyes there is very little change in acuity or sensitivity with increasing (bilateral) refractive error except for one extreme individual (bilaterally refractive error of -15 D). Most pure anisometropes with interocular differences less than 4D retain some stereopsis, and the degree is correlated with the acuity of the weak eye. We conclude that even modest interocular differences in refractive error can influence visual function.
Copyright © 2010 Elsevier Ltd. All rights reserved.
Figures


Similar articles
-
Observations on the relationship between anisometropia, amblyopia and strabismus.Vision Res. 2017 May;134:26-42. doi: 10.1016/j.visres.2017.03.004. Epub 2017 Apr 18. Vision Res. 2017. PMID: 28404522 Free PMC article. Review.
-
The pattern of visual deficits in amblyopia.J Vis. 2003;3(5):380-405. doi: 10.1167/3.5.5. J Vis. 2003. PMID: 12875634
-
Neuronal correlates of amblyopia in the visual cortex of macaque monkeys with experimental strabismus and anisometropia.J Neurosci. 1998 Aug 15;18(16):6411-24. doi: 10.1523/JNEUROSCI.18-16-06411.1998. J Neurosci. 1998. PMID: 9698332 Free PMC article.
-
[Study of the visual deficits pattern in strabismic and anisometropic amblyopia].Zhonghua Yan Ke Za Zhi. 2013 Jul;49(7):615-20. Zhonghua Yan Ke Za Zhi. 2013. PMID: 24257357 Chinese.
-
Stereopsis and amblyopia: A mini-review.Vision Res. 2015 Sep;114:17-30. doi: 10.1016/j.visres.2015.01.002. Epub 2015 Jan 29. Vision Res. 2015. PMID: 25637854 Free PMC article. Review.
Cited by
-
Saccadic latency in amblyopia.J Vis. 2016;16(5):3. doi: 10.1167/16.5.3. J Vis. 2016. PMID: 26943348 Free PMC article.
-
Observations on the relationship between anisometropia, amblyopia and strabismus.Vision Res. 2017 May;134:26-42. doi: 10.1016/j.visres.2017.03.004. Epub 2017 Apr 18. Vision Res. 2017. PMID: 28404522 Free PMC article. Review.
-
Brief period of monocular deprivation drives changes in audiovisual temporal perception.J Vis. 2020 Aug 3;20(8):8. doi: 10.1167/jov.20.8.8. J Vis. 2020. PMID: 32761108 Free PMC article.
-
Rethinking amblyopia 2020.Vision Res. 2020 Nov;176:118-129. doi: 10.1016/j.visres.2020.07.014. Epub 2020 Aug 28. Vision Res. 2020. PMID: 32866759 Free PMC article. Review.
-
Reduced evoked activity and cortical oscillations are correlated with anisometric amblyopia and impairment of visual acuity.Sci Rep. 2021 Apr 15;11(1):8310. doi: 10.1038/s41598-021-87545-9. Sci Rep. 2021. PMID: 33859272 Free PMC article.
References
-
- Abrahamsson M, Fabian G, Andersson AK, Sjostrand J. A longitudenal study of a population based sample of astigmatic children. I. Refraction and amblyopia. Acta Ophthal. 1990;68:428–434. - PubMed
-
- Almeder LM, Peck LB, Howland HC. Prevalence of anisometropia in volunteer laboratory and school screening populations. Invest Ophthal Vis Sci. 1990;31:2448–2455. - PubMed
-
- Antón A, Andrada MT, Mayo A, Portela J, Merayo J. Epidemiology of refractive errors in an adult European population: the Segovia study. Ophthalmic Epidemiol. 2009;16:231–237. - PubMed
-
- Bedell HE, Patel S, Chung ST. Comparison of letter and Vernier acuities with dioptric and diffusive blur. Optom Vis Sci. 1999;76:115–120. - PubMed
Publication types
MeSH terms
Grants and funding
LinkOut - more resources
Full Text Sources
