. 2010 Oct 29;33(4):597-606.
doi: 10.1016/j.immuni.2010.09.012. Epub 2010 Oct 7.

Mammalian target of rapamycin controls dendritic cell development downstream of Flt3 ligand signaling

Affiliations

Mammalian target of rapamycin controls dendritic cell development downstream of Flt3 ligand signaling

Taheri Sathaliyawala et al. Immunity. .

Abstract

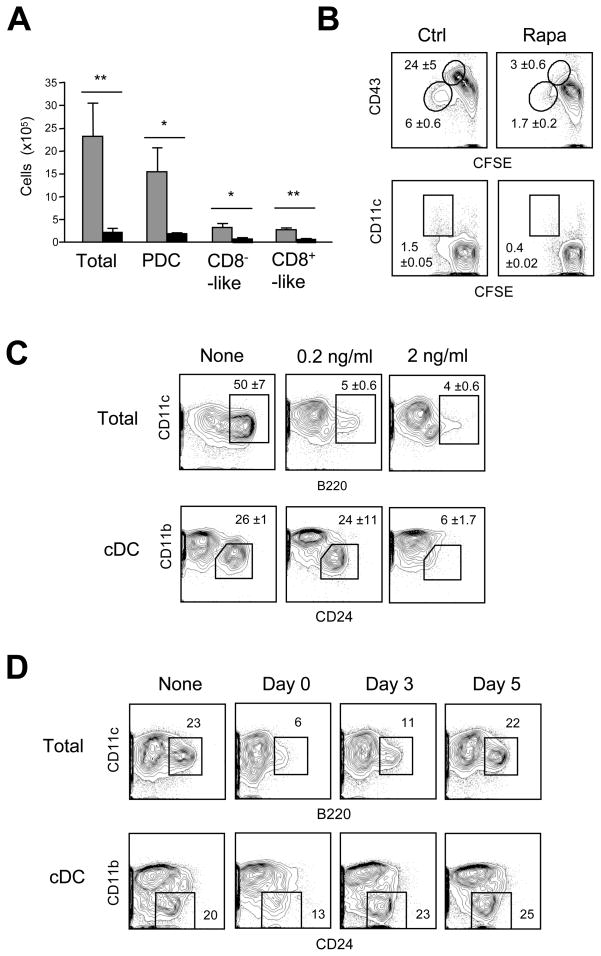
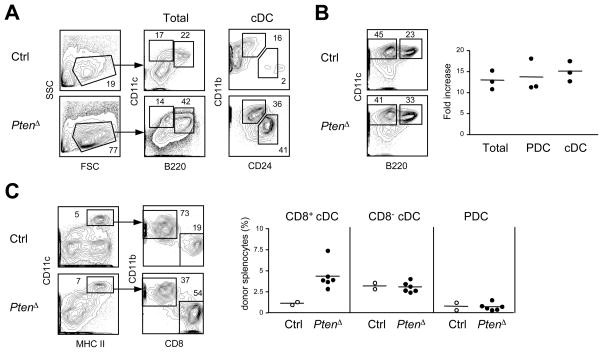
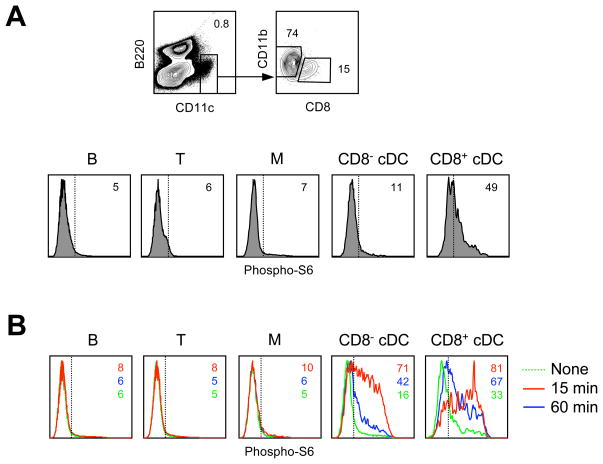
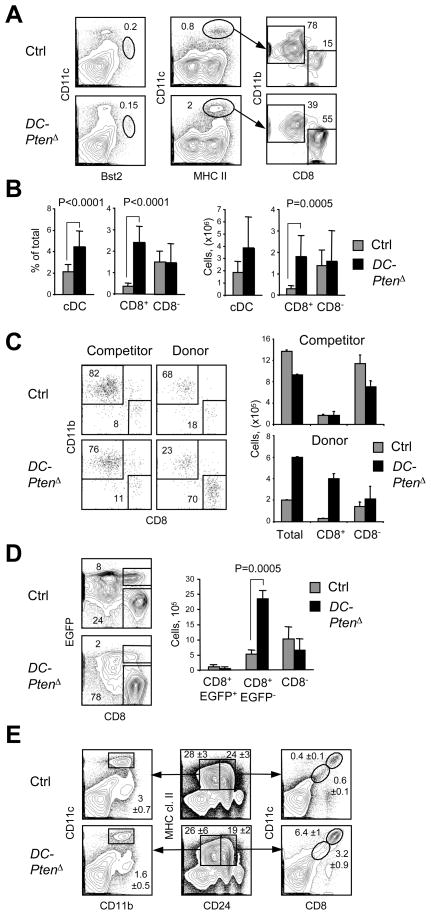
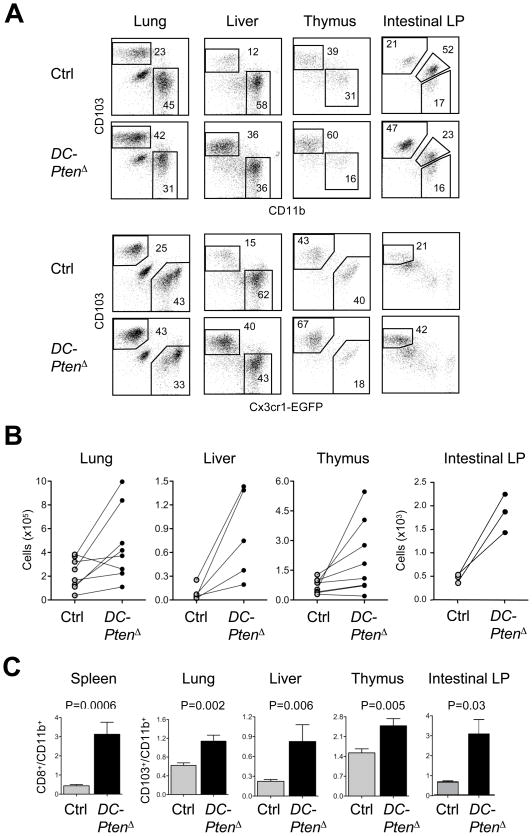
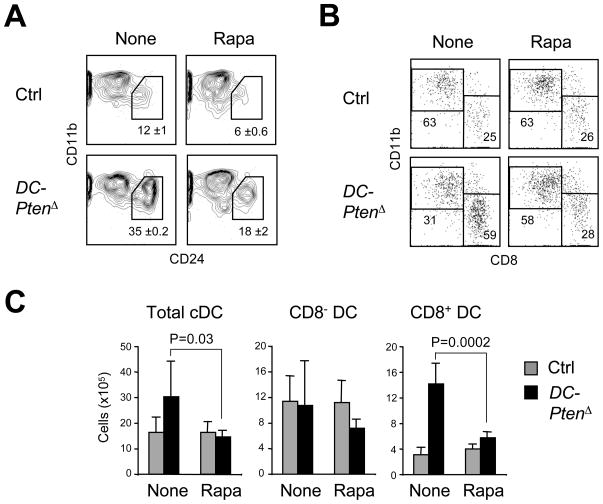
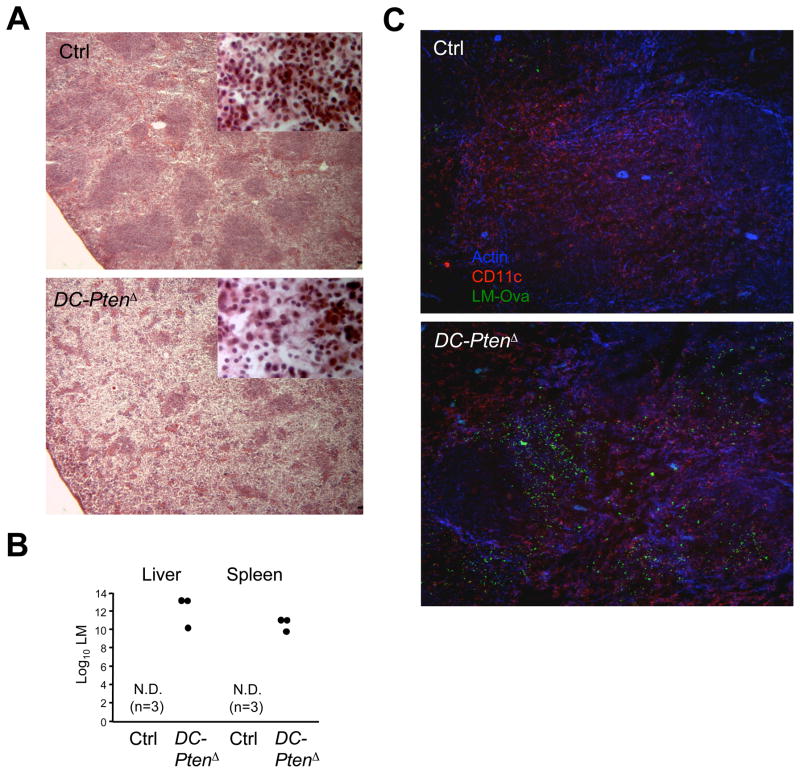
Dendritic cells (DCs) comprise distinct functional subsets including CD8⁻ and CD8(+) classical DCs (cDCs) and interferon-secreting plasmacytoid DCs (pDCs). The cytokine Flt3 ligand (Flt3L) controls the development of DCs and is particularly important for the pDC and CD8(+) cDC and their CD103(+) tissue counterparts. We report that mammalian target of rapamycin (mTOR) inhibitor rapamycin impaired Flt3L-driven DC development in vitro, with the pDCs and CD8(+)-like cDCs most profoundly affected. Conversely, deletion of the phosphoinositide 3-kinase (PI3K)-mTOR negative regulator Pten facilitated Flt3L-driven DC development in culture. DC-specific Pten targeting in vivo caused the expansion of CD8(+) and CD103(+) cDC numbers, which was reversible by rapamycin. The increased CD8(+) cDC numbers caused by Pten deletion correlated with increased susceptibility to the intracellular pathogen Listeria. Thus, PI3K-mTOR signaling downstream of Flt3L controls DC development, and its restriction by Pten ensures optimal DC pool size and subset composition.


Conflict of interest statement

Competing Interests Statement

Technologies associated with phospho-flow are licensed in part to BD Biosciences, and G.P.N. is a consultant for BD Biosciences, a supplier of the reagents used in this report. Other authors declare no competing interests.

Figures

Figure 1
Figure 1. Rapamycin inhibits Flt3L-driven DC development in vitro
(A) The effect of rapamycin on DC development in vitro. Wild-type BM was cultured in the presence of Flt3L with or without 10 ng/ml rapamycin, and analyzed by flow cytometry on day 8 for the resulting pDCs (CD11c+ B220+ CD11b), CD8-like cDCs (CD11c+ B220 CD11bhi) and CD8+-like cDCs (CD11c+ B220 CD11blo). Shown are absolute cell numbers per 2x10⁶ input BM cells (mean ± S.D. of three independent cultures); *P<0.05; **P<0.01. (B) The effect of rapamycin on DC progenitor expansion. CFSE-labeled BM cells were cultured with Flt3L with or without rapamycin, and analyzed on day 3. Highlighted are CFSE-diluting pro-DCs with high or low CD43 expression (upper panels) and CFSElo CD11c+ pre-DCs (lower panels), with average percentages ± range of two independent cultures. (C) The effect of rapamycin at low doses. BM cells were cultured with Flt3L and the indicated doses of rapamycin. Shown are staining profiles on day 8, highlighting CD11c+ B220+ pDCs (top) and CD24+ CD11blo CD8+-like cDCs among the gated CD11c+ MHC II+ cDCs (bottom). Average percentages ±S.D. of three independent cultures are indicated. (D) Time-dependent rapamycin activity in Flt3L-supplemented BM cultures. Rapamycin (10 ng/ml) was added at the indicated days, and the cultures were analyzed on day 9. Representative of 4 independent cultures.
Figure 2
Figure 2. Pten deletion in the BM facilitates DC development
Global Pten deletion was induced by tamoxifen administration to Ptenfl/fl Gt(ROSA)26Sor-CreER+ animals (PtenΔ) or littermate controls (Ctrl) 5 days prior to BM isolation. (A) DC development in Flt3L-supplemented BM cultures on day 5. Shown are staining profiles representative of two independent experiments, with total live cells (forward versus side scatter gate), CD11c+ B220+ pDCs, CD11c+ B220 cDCs and their subsets highlighted. (B) DC development in Flt3L-supplemented BM cultures at the endpoint. Cultures described in panel (A) were analyzed on days 8–9. Shown are representative staining profiles of total live cells, and fold increase of the absolute DC numbers in PtenΔ over control cultures (three independent experiments). (C) DC development in vivo in the BM chimeras. BM cells from each tamoxifen-treated animal (one control and three PtenΔ) were transferred into two irradiated recipients, and splenic DCs were analyzed 6 wk thereafter. Shown are representative staining profiles of donor-derived (CD45.2+) DCs, and the fractions of cDCs (CD11chi MHC II+ CD8+ or CD8) and pDCs (CD11clo B220+ Bst2+) among the total donor-derived splenocytes.
Figure 3
Figure 3. mTOR signaling in DCs in vivo
(A) The expression of phosphorylated S6 protein (p-S6) in the splenocytes of naïve wild-type mice. Shown is the definition of cDC subsets in ex vivo splenocytes after instant fixation, and p-S6 expression in T cells (CD90+), B cells (B220+ CD11c), monocytes or macrophages (M, CD11blo CD11c) and cDCs. Positive staining threshold is indicated by the dotted line. (B) The induction of p-S6 by Flt3L in vivo. Shown are histograms of intracellular p-S6 fluorescence in the indicated cell types 15 or 60 minutes after Flt3L administration.
Figure 4
Figure 4. DC-specific Pten deletion causes the expansion of CD8+ cDCs
(A) Staining profiles of splenic DC populations in Ptenfl/fl Itgax-Cre+ animals with DC-specific Pten deletion (DC-PtenΔ) and in littermate controls (Ctrl), highlighting CD11clo Bst2+ pDCs, CD11chi MHC II+ cDCs and their subsets. (B) The fraction and absolute number of cDC subsets in DC-PtenΔ and control spleens (n=10–11). The P values of statistically significant differences are indicated. (C) The analysis of DCs in hematopoietic chimeras reconstituted with a mixture of the control or DC-PtenΔ BM (CD45.2+) and wild-type CD45.1+ competitor BM. Shown are representative staining profiles and the absolute numbers of donor- and competitor-derived splenic cDC subsets (mean ± S.D. of 3 recipient animals). (D) Splenic cDC subsets in Cx3cr1-EGFP+ DC-PtenΔ and littermate control mice. Shown are staining profiles of CD11chi MHC II+ cDCs with EGFP+ and EGFP CD8+ cDC subsets highlighted, and absolute numbers of cDC subsets (n=4–5). (E) Immature splenic cDC populations in DC-PtenΔ and control mice. Shown are staining profiles of gated MHC II+ CD24+ or CD24 populations containing mature CD11chi cDC subsets as well as CD11clo CD8lo immature cDCs (mean ± S.D. of three animals).
Figure 5
Figure 5. The expansion of CD103+ cDCs following Pten deletion
(A) The CD103+ versus CD11b+ cDC subset distribution in the tissues of DC-specific DC-PtenΔ mice. Shown are representative staining profiles of DAPI CD45+ CD11chi MHC II+ cDCs from the indicated tissues of Cx3cr1-EGFP+ DC-PtenΔ and control mice. The populations of CD103+ and CD11b+ or Cx3cr1-EGFP+ DCs are highlighted; the intestinal lamina propria (LP) contains an additional CD103+ CD11b+ population. (B) Absolute numbers of CD103+ cDCs in individual DC-PtenΔ mice shown by pairwise comparison to the corresponding littermate control. (C) The ratio of CD103+ CD11b to CD103 CD11b+ fractions among cDCs from control and DC-PtenΔ mice (mean ± S.E.M. of 8–9 animals for all tissues except intestinal LP, for which n=3).
Figure 6
Figure 6. mTOR blockade reverses the expansion of Pten-deficient DCs
(A) Rapamycin treatment of Flt3L-supplemented BM cultures from DC-PtenΔ and control mice. Rapamycin was added on day 3 of culture. Shown are staining profiles of gated CD11c+ B220 cDCs highlighting the CD11blo CD24hi CD8+ cDC-like subset (mean ± range of two independent cultures). (B) Rapamycin treatment of DC-PtenΔ and control animals. Shown are representative staining profiles of splenic CD11chi MHC II+ cDCs from mice treated for 7 days with rapamycin or vehicle only. (C) Absolute numbers of splenic cDC subsets from DC-PtenΔ and control animals treated with rapamycin (5–6 animals per group).
Figure 7
Figure 7. DC-specific Pten deletion increases sensitivity to Listeria infection
(A) Spleen histology of control and DC-PtenΔ mice on day 6 after infection with 2x10⁴ LM-OVA bacteria (H&E staining, 25x magnification; inset, 400x magnification). Uninfected control or DC-PtenΔ mice showed no difference by histology (not shown). (B) Bacterial titers on day 6 after infection with 2x10⁵ LM-OVA. All DC-PtenΔ mice were moribund and showed prominent inflammation of the spleen and liver. Symbols represent individual animals; N.D., not detected. (C) Immunohistochemical analysis of the spleen 24 hr after infection with 105 LM-OVA. Frozen spleen sections were stained for polymerized actin, CD11c and ovalbumin to detect LM-OVA.

Comment in

References

    1. Alaniz RC, Sandall S, Thomas EK, Wilson CB. Increased dendritic cell numbers impair protective immunity to intracellular bacteria despite augmenting antigen-specific CD8+ T lymphocyte responses. J Immunol. 2004;172:3725–3735. - PubMed
    1. Anzelon AN, Wu H, Rickert RC. Pten inactivation alters peripheral B lymphocyte fate and reconstitutes CD19 function. Nat Immunol. 2003;4:287–294. - PubMed
    1. Aoshi T, Carrero JA, Konjufca V, Koide Y, Unanue ER, Miller MJ. The cellular niche of Listeria monocytogenes infection changes rapidly in the spleen. Eur J Immunol. 2009;39:417–425. - PMC - PubMed
    1. Aoshi T, Zinselmeyer BH, Konjufca V, Lynch JN, Zhang X, Koide Y, Miller MJ. Bacterial entry to the splenic white pulp initiates antigen presentation to CD8+ T cells. Immunity. 2008;29:476–486. - PubMed
    1. Bar-On L, Birnberg T, Lewis KL, Edelson BT, Bruder D, Hildner K, Buer J, Murphy KM, Reizis B, Jung S. CX3CR1+ CD8alpha+ dendritic cells are a steady state population related to plasmacytoid dendritic cells. Proc Natl Acad Sci U S A. 2010;107:14745–50. - PMC - PubMed

Publication types

MeSH terms