. 2011 Dec 1;81(5):1442-57.
doi: 10.1016/j.ijrobp.2010.07.1977. Epub 2010 Oct 8.

Consideration of dose limits for organs at risk of thoracic radiotherapy: atlas for lung, proximal bronchial tree, esophagus, spinal cord, ribs, and brachial plexus

Affiliations

Consideration of dose limits for organs at risk of thoracic radiotherapy: atlas for lung, proximal bronchial tree, esophagus, spinal cord, ribs, and brachial plexus

Feng-Ming Spring Kong et al. Int J Radiat Oncol Biol Phys. .

Abstract

Purpose: To review the dose limits and standardize the three-dimenional (3D) radiographic definition for the organs at risk (OARs) for thoracic radiotherapy (RT), including the lung, proximal bronchial tree, esophagus, spinal cord, ribs, and brachial plexus.

Methods and materials: The present study was performed by representatives from the Radiation Therapy Oncology Group, European Organization for Research and Treatment of Cancer, and Soutwestern Oncology Group lung cancer committees. The dosimetric constraints of major multicenter trials of 3D-conformal RT and stereotactic body RT were reviewed and the challenges of 3D delineation of these OARs described. Using knowledge of the human anatomy and 3D radiographic correlation, draft atlases were generated by a radiation oncologist, medical physicist, dosimetrist, and radiologist from the United States and reviewed by a radiation oncologist and medical physicist from Europe. The atlases were then critically reviewed, discussed, and edited by another 10 radiation oncologists.

Results: Three-dimensional descriptions of the lung, proximal bronchial tree, esophagus, spinal cord, ribs, and brachial plexus are presented. Two computed tomography atlases were developed: one for the middle and lower thoracic OARs (except for the heart) and one focusing on the brachial plexus for a patient positioned supine with their arms up for thoracic RT. The dosimetric limits of the key OARs are discussed.

Conclusions: We believe these atlases will allow us to define OARs with less variation and generate dosimetric data in a more consistent manner. This could help us study the effect of radiation on these OARs and guide high-quality clinical trials and individualized practice in 3D-conformal RT and stereotactic body RT.


Conflict of interest statement

Conflict of interest: none.

Figures

Fig. 1
Fig. 1
Variance in normal lung definition and its effect on lung dose–volume histograms (DVH). Autosegmentation often leads to inaccurate lung volume, with (A) arrows showing autotracked lung structure going into lung parenchyma causing exclusion of some normal lungs and (B) with misses of lung parenchyma between tumors and small vessels) that causes notable differences in lung DVHs (C). Calculation of lung DVH in consideration of target and treatment volumes also affects lung DVH (D). Unless otherwise specified, lung refers to both lungs with subtraction of gross tumor volume (GTV). CTV = clinical target volume; PTV = planning target volume; AA = ascending aorta; DA = descending aorta; SVC = superior venous cava; PA = pulmonary artery.
Fig. 2
Fig. 2
Example variations of esophagus definition. (A) Collier et al. (3) demonstrated completely different esophagus contours by 2 dosimetrists. (B) Dieleman et al. (6) demonstrated motion of esophagus (green during exhale phase, purple during inhale phase).
Fig. 3
Fig. 3
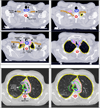
Atlas of lung, proximal bronchial tree, esophagus, and spinal cord. Brachial plexus, brown; spinal cord, thick red; lung, yellow; proximal bronchus tree, green; primary tumor GTV and nodal GTV, thin red; esophagus, dark blue; ascending aorta, aortic arch, and descending aorta, purple; superior vena cava, light blue; pulmonary artery, white. GTV = gross tumor volume; AA = ascending aorta; DA = descending aorta; SVC = superior vena cava; PA = pulmonary artery; IVC = inferior vena cava.
Fig. 3
Fig. 3
Atlas of lung, proximal bronchial tree, esophagus, and spinal cord. Brachial plexus, brown; spinal cord, thick red; lung, yellow; proximal bronchus tree, green; primary tumor GTV and nodal GTV, thin red; esophagus, dark blue; ascending aorta, aortic arch, and descending aorta, purple; superior vena cava, light blue; pulmonary artery, white. GTV = gross tumor volume; AA = ascending aorta; DA = descending aorta; SVC = superior vena cava; PA = pulmonary artery; IVC = inferior vena cava.
Fig. 4
Fig. 4
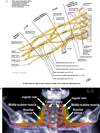
Atlas of brachial plexus. (A) Brachial plexus anatomy. (B) Digital reconstructed radiograph. Brown used to indicate brachial plexus; red, carotid artery; light blue, jugular vein; and green, middle scalene muscle. (C) Axial computed tomography sections through brachial plexus. Red indicates internal carotid arteries, subclavian arteries, and innominate artery; light blue, internal jugular veins, subclavian veins; red within spine, spinal cord; dark blue, esophagus; pink, anterior scalene muscle; green, middle scalene muscle; light orange, brachial plexus structures (i.e., nerves, roots, trunks). VB = vertebral body level (e.g., C4 indicates C4 vertebral body level); CA = carotid artery; JV = jugular vein; AS = anterior scalene muscle; MS = middle scalene muscle.
Fig. 4
Fig. 4
Atlas of brachial plexus. (A) Brachial plexus anatomy. (B) Digital reconstructed radiograph. Brown used to indicate brachial plexus; red, carotid artery; light blue, jugular vein; and green, middle scalene muscle. (C) Axial computed tomography sections through brachial plexus. Red indicates internal carotid arteries, subclavian arteries, and innominate artery; light blue, internal jugular veins, subclavian veins; red within spine, spinal cord; dark blue, esophagus; pink, anterior scalene muscle; green, middle scalene muscle; light orange, brachial plexus structures (i.e., nerves, roots, trunks). VB = vertebral body level (e.g., C4 indicates C4 vertebral body level); CA = carotid artery; JV = jugular vein; AS = anterior scalene muscle; MS = middle scalene muscle.

Comment in

References

    1. Jemal A, Siegel R, Ward E, et al. Cancer statistics, 2009. CA Cancer J Clin. 2009;59:225–249. - PubMed
    1. Tyldesley S, Boyd C, Schulze K, et al. Estimating the need for radiotherapy for lung cancer: An evidence-based, epidemiologic approach. Int J Radiat Oncol Biol Phys. 2001;49:973–985. - PubMed
    1. Collier DC, Burnett SS, Amin M, et al. Assessment of consistency in contouring of normal-tissue anatomic structures. J Appl Clin Med Phys. 2003;4:17–24. - PMC - PubMed
    1. Emami B, Lyman J, Brown A, et al. Tolerance of normal tissue to therapeutic irradiation. Int J Radiat Oncol Biol Phys. 1991;21:109–122. - PubMed
    1. Kong FM, Pan C, Eisbruch A, et al. Physical models and simpler dosimetric descriptors of radiation late toxicity. Semin Radiat Oncol. 2007;17:108–120. - PubMed

Publication types

MeSH terms