

Age-associated changes in miRNA expression profiles in thymopoiesis
- PMID: 20934450
- PMCID: PMC3005860
- DOI: 10.1016/j.mad.2010.09.008
Age-associated changes in miRNA expression profiles in thymopoiesis
Abstract
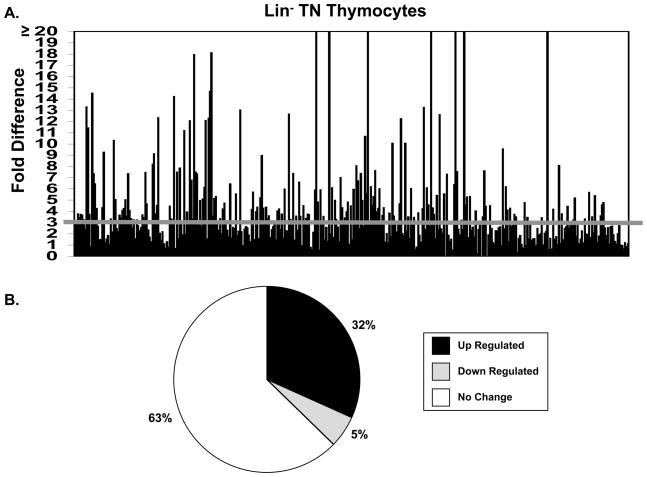
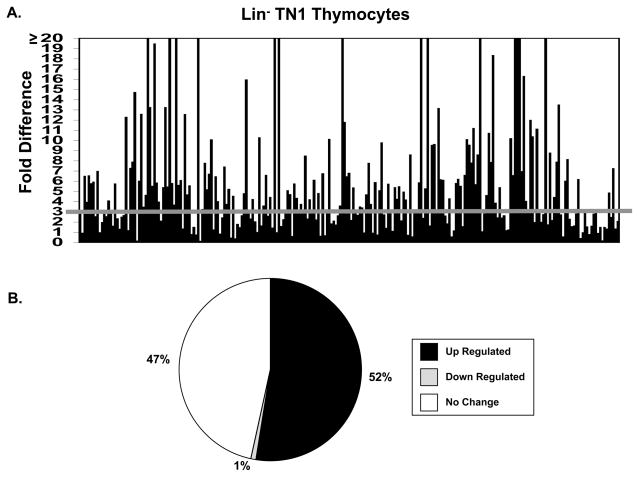
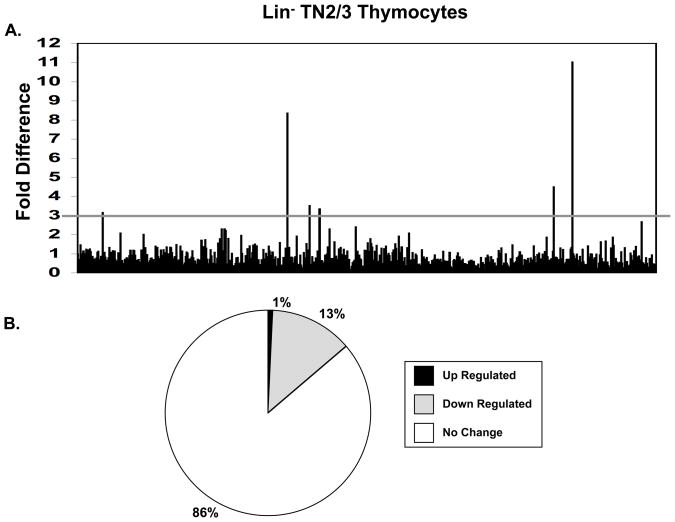
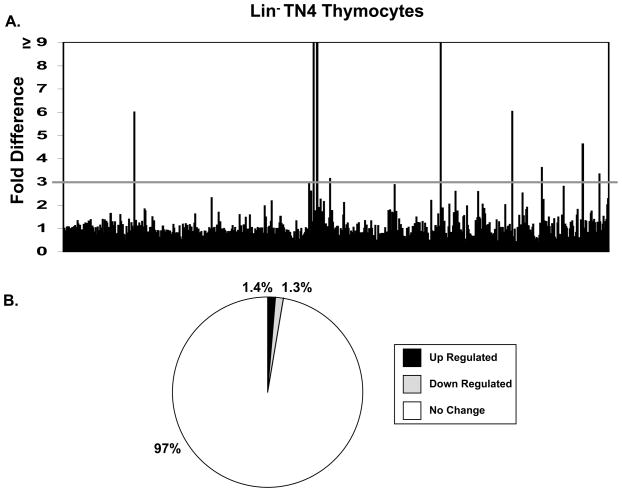
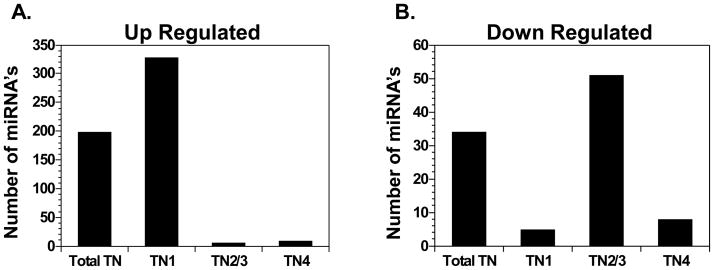
During adult life, the thymus involutes and thymic output of mature T cells drastically declines. The molecular events underlying this process are not well understood. Here, we present evidence of the importance of miRNAs in regulating T cell differentiation in the aged. miRNAs are a wide-ranging regulatory element influencing gene expression throughout the lifetime of the organism. To establish whether they play a role in the age-specific thymic decline, the miRNA expression pattern was examined in TN subsets of young and aged mice. Fifty-two percent of the miRNAs exhibited elevated expression levels in the aged TN1 cells. This expression profile leads us to hypothesize that the large number of highly expressed miRNAs, indicative of rigidly controlled protein expression, limits the developmental potential of this population and results in the age-induced decline in thymopoiesis.
Copyright © 2010 Elsevier Ireland Ltd. All rights reserved.
Figures
Similar articles
-
Transcriptome analysis of murine thymic epithelial cells reveals age‑associated changes in microRNA expression.Int J Mol Med. 2013 Oct;32(4):835-42. doi: 10.3892/ijmm.2013.1471. Epub 2013 Aug 21. Int J Mol Med. 2013. PMID: 23969555
-
MicroRNA Functions in Thymic Biology: Thymic Development and Involution.Front Immunol. 2018 Sep 11;9:2063. doi: 10.3389/fimmu.2018.02063. eCollection 2018. Front Immunol. 2018. PMID: 30254640 Free PMC article. Review.
-
Despite high levels of expression in thymic epithelial cells, miR-181a1 and miR-181b1 are not required for thymic development.PLoS One. 2018 Jun 27;13(6):e0198871. doi: 10.1371/journal.pone.0198871. eCollection 2018. PLoS One. 2018. PMID: 29949604 Free PMC article.
-
MicroRNA-205 Maintains T Cell Development following Stress by Regulating Forkhead Box N1 and Selected Chemokines.J Biol Chem. 2016 Oct 28;291(44):23237-23247. doi: 10.1074/jbc.M116.744508. Epub 2016 Sep 19. J Biol Chem. 2016. PMID: 27646003 Free PMC article.
-
Role of miRNAs in Normal and Myasthenia Gravis Thymus.Front Immunol. 2020 Jun 10;11:1074. doi: 10.3389/fimmu.2020.01074. eCollection 2020. Front Immunol. 2020. PMID: 32587589 Free PMC article. Review.
Cited by
-
Regulatory RNAs in immunosenescence.Immun Inflamm Dis. 2024 Mar;12(3):e1209. doi: 10.1002/iid3.1209. Immun Inflamm Dis. 2024. PMID: 38456619 Free PMC article. Review.
-
Sex- and age-interacting eQTLs in human complex diseases.Hum Mol Genet. 2014 Apr 1;23(7):1947-56. doi: 10.1093/hmg/ddt582. Epub 2013 Nov 15. Hum Mol Genet. 2014. PMID: 24242183 Free PMC article.
-
MicroRNAs as Haematopoiesis Regulators.Adv Hematol. 2013;2013:695754. doi: 10.1155/2013/695754. Epub 2013 Dec 24. Adv Hematol. 2013. PMID: 24454381 Free PMC article. Review.
-
Involvement of MicroRNAs in the Aging-Related Decline of CD28 Expression by Human T Cells.Front Immunol. 2018 Jun 18;9:1400. doi: 10.3389/fimmu.2018.01400. eCollection 2018. Front Immunol. 2018. PMID: 29967621 Free PMC article.
-
Discovery of novel microRNAs in rat kidney using next generation sequencing and microarray validation.PLoS One. 2012;7(3):e34394. doi: 10.1371/journal.pone.0034394. Epub 2012 Mar 28. PLoS One. 2012. PMID: 22470567 Free PMC article.
References
-
- Anderson G, Moore NC, Owen JJ, Jenkinson EJ. Cellular interactions in thymocyte development. Annu Rev Immunol. 1996;14:73–99. - PubMed
-
- Betel D, Wilson M, Gabow A, Marks DS, Sander C. The microRNA.org resource: targets and expression. Nucleic Acids Res. 2008;36:D149–153. - PMC - PubMed
-
- Chen CZ, Li L, Lodish HF, Bartel DP. MicroRNAs modulate hematopoietic lineage differentiation. Science. 2004;303:83–86. - PubMed
Publication types
MeSH terms
Substances
Grants and funding
LinkOut - more resources
Full Text Sources
Medical
