. 2010 Nov;177(5):2191-204.
doi: 10.2353/ajpath.2010.100217. Epub 2010 Oct 7.

Co-activation of epidermal growth factor receptor and c-MET defines a distinct subset of lung adenocarcinomas

Affiliations

Co-activation of epidermal growth factor receptor and c-MET defines a distinct subset of lung adenocarcinomas

Daisuke Matsubara et al. Am J Pathol. 2010 Nov.

Abstract

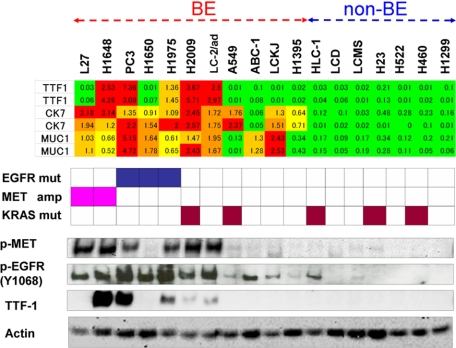
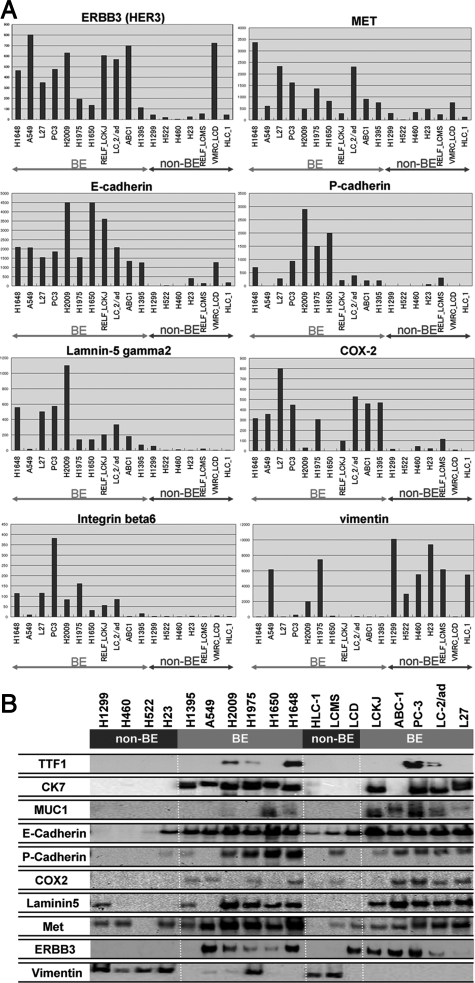
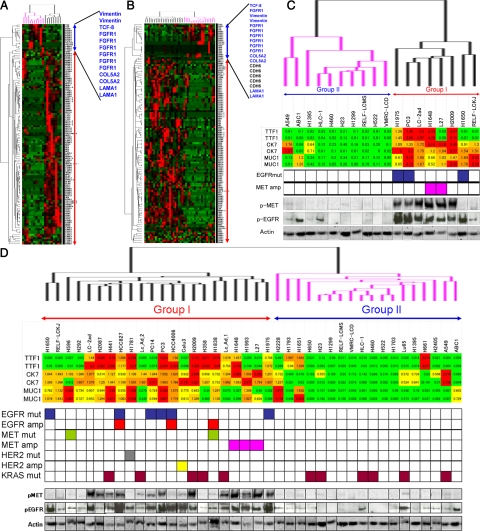
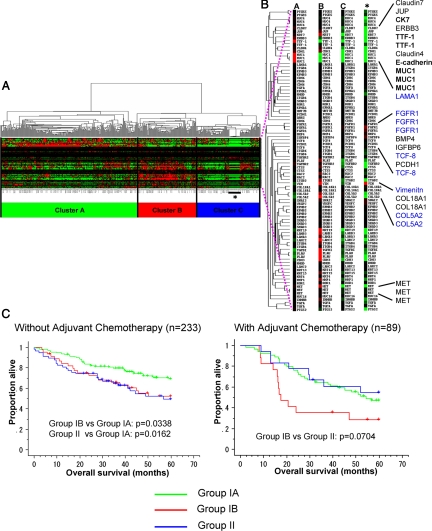
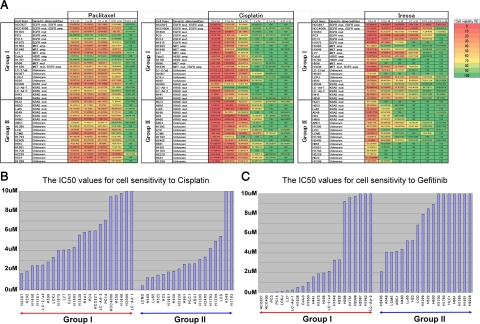
Epidermal growth factor receptor (EGFR) and MET are molecular targets for lung cancer treatment. The relationships between expression, activation, and gene abnormalities of these two targets are currently unclear. Here, we demonstrate that a panel of 40 lung cancer cell lines could be classified into two groups. Group I was characterized by (1) high phosphorylations of MET and EGFR, (2) frequent mutation or amplification of EGFR, MET, and human epidermal growth factor receptor-2 (HER2), (3) high expressions of bronchial epithelial markers (thyroid transcription factor-1 (TTF-1), MUC1, and Cytokeratin 7 (CK7)); and (4) high expressions of MET, human epidermal growth factor receptor-3, E-cadherin, cyclooxygenase-2, and laminin gamma2. In contrast, Group II exhibited little or no phosphorylation of MET and EGFR; no mutation or amplification of EGFR, MET, and HER2; were triple-negative for TTF-1, MUC1, and CK7; and showed high expressions of vimentin, fibroblast growth factor receptor-1, and transcription factor 8. Importantly, Group I was more sensitive to gefitinib and more resistant to cisplatin and paclitaxel than Group II. The clinical relevance was confirmed in publicly available data on 442 primary lung adenocarcinoma patients; survival benefits by postoperative chemotherapy were seen in only patients with tumors corresponding to Group II. Overall, co-activation of EGFR and MET defines a distinct subgroup of lung carcinoma with characteristic genetic abnormalities, gene expression pattern, and response to chemotherapeutic reagents.


Figures

Figure 1
Figure 1
Comparison of MUC1, CK7, and TTF-1 expression levels with the status of EGFR, MET, and KRAS and the activation profiles of EGFR and MET in a panel of lung carcinoma cell lines. Upper panel shows the gene expression levels of MUC1, CK7, and TTF-1 expressed to relative to the average (= 1.0) of 18 cell lines, and color indication is as described for supplemental Table S1 at http://ajp.amjpathol.org. Middle panel shows cell lines harboring EGFR mutation (blue box), MET amplification (pink box), and KRAS mutation (brown box). Lower panel shows the protein levels of phospho-MET, phospho-EGFR (Y1068), and TTF-1 expression (This lower panel is rearranged in Figure 3C, Figure 3D, and supplemental Figure S1B at http://ajp.amjpathol.org.). MET was highly phosphorylated in 6 cell lines (L27, H1648, PC3, H1975, H2009, and LC-2/ad), and EGFR was highly phosphorylated in seven cell lines (L27, H1648, PC3, H1650, H1975, H2009, and LC-2/ad). Thus, a striking overlap was noted between activation profiles of EGFR and MET. TTF-1 expression was correlated with EGFR and MET activation, but the cell lines that express TTF-1 were more restricted than those that express phospho-MET or phospho-EGFR (Y1068) at high levels. Thus, the cell lines may be broadly divided into two groups; bronchial epithelial phenotype (BE) and non-bronchial epithelial phenotype (non-BE) based on expression levels of MUC1, CK7, and TTF-1 and the activation profiles of EGFR and MET.
Figure 2
Figure 2
A: Genes selectively expressed in the bronchial epithelial phenotype (BE) and nonbronchial epithelial phenotype (non-BE). The expression levels of the indicated genes are shown in the bar graphs. B: Western blot analysis of the gene products selectively expressed in the bronchial epithelial phenotype (BE) and non-bronchial epithelial phenotype (non-BE). The results largely confirmed the data obtained at the mRNA level by oligonucleotide array analysis.
Figure 3
Figure 3
A: Hierarchical cluster analysis of the initial 18 lung cancer cell lines using the genes selectively expressed in the bronchial epithelial phenotype and nonbronchial epithelial phenotype cell lines. The blue bar indicates genes selectively expressed in nonbronchial epithelial phenotype, and the red bar indicates genes selectively expressed in bronchial epithelial phenotype. B: Hierarchical cluster analysis of the entire panel of 40 cancer cell lines using the genes selectively expressed in the bronchial epithelial phenotype and nonbronchial epithelial phenotype cell lines. C: Enlarged view of the array; dendrogram shown in panel A along with sample identification (upper panel). Under the array dendrogram, TTF-1, CK7, and MUC-1 expressions, the status of EGFR and MET and the activation profiles of EGFR and MET of the 18 cell lines are shown. D: Enlarged view of the array dendrogram shown in panel B along with sample identification (upper panel). Under the array dendrogram, TTF-1, CK7, and MUC-1 expressions, the status of EGFR, MET, HER2, and KRAS, and the activation profiles of EGFR and MET of the 40 cell lines are shown.
Figure 4
Figure 4
Analysis of publicly available data of 442 primary lung adenocarcinoma cases. A: Hierarchical cluster analysis using the genes selectively expressed in bronchial epithelial phenotype and nonbronchial epithelial phenotype. B: Cluster A showed high expression of terminal bronchial epithelial markers (CK7, TTF-1, and E-cadherin), whereas Cluster B showed modest expression of bronchial epithelial markers (CK7, TTF-1, and E-cadherin) and high expression of a subset of genes (u-PA, P-cadherin, LAMB3, LAMC2, ITGB4, etc) that is associated with cancer cell invasion (see Discussion). In contrast, Cluster C showed very low expression of both bronchial epithelial markers and cancer invasion-associated genes that characterized Group I. The genes selectively expressed in Group II were not clustered together. However, this is due to stromal contamination in primary tumors, as evidenced by the high expression of FGFR1 and vimentin in normal control lung tissue (asterisk). C: Patient survival curves of Group IA (green line), Group IB (red line), and Group II (blue line). Patients without adjuvant chemotherapy (left panel), and those with adjuvant chemotherapy (right panel) were separately analyzed.
Figure 5
Figure 5
A. Sensitivities of 40 lung cancer cell lines to paclitaxel (left), cisplatin (middle), and gefitinib (right). The viability of cells with each concentration is shown by color gradation (color scale is shown in extreme right panel). Paclitaxel was relatively effective against most of the cell lines at 0.1 μmol/L , but four cell lines (PC3, PC14, Calu3, and H1781), belonging to Group I, were resistant even at high concentration. Cisplatin needed higher concentration to be effective as compared with paclitaxel. Cisplatin was more effective against Group II than Group I at about 1 μmol/L. Gefitinib was more effective against Group I than Group II at any concentration tested. It was also of note that KRAS-mutated Group I cell lines were more sensitive to gefitinib than KRAS-mutated Group II cell lines. B and C: Comparisons of the IC50 values for cisplatin (B) and gefitinib (C) between Group I and Group II cell lines. Group II cancer cells were more sensitive to cisplatin than Group I cancer cells (B, P = 0.0115, Mann-Whitney U-test). Group I cancer cells were more sensitive to gefitinib than Group II cancer cells (C, P = 0.0017, Mann-Whitney U-test). Upper-limit values of the graphs are set to be 10 μmol/L.

References

    1. Tokyo: Ministry of Health, Labor, and Welfare; Statistics and Information Department. Vital Statistics, 2000. 2001
    1. Jemal A, Siegel R, Ward E, Murray T, Xu J, Smigal C, Thun MJ. Cancer Statistics, 2006. CA Cancer J Clin. 2006;56:106–130. - PubMed
    1. Naruke T, Tsuchiya R, Kondo H, Asamura H. Prognosis and survival after resection for bronchogenic carcinoma based on the 1997 TNM-staging classification: the Japanese experience. Ann Thorac Surg. 2001;71:1759–1764. - PubMed
    1. Janssen-Heijnen ML, Coebergh JW. Trends in incidence and prognosis of the histological subtypes of lung cancer in North America. Australia, New Zealand and Europe. Lung Cancer. 2001;31:123–137. - PubMed
    1. Riely GJ, Politi KA, Miller VA, Pao W. Update on epidermal growth factor receptor mutations in non-small cell lung cancer. Clin Cancer Res. 2006;12:7232–7241. - PubMed

Publication types

MeSH terms