. 2010 Nov 1;24(21):2395-407.
doi: 10.1101/gad.1975210. Epub 2010 Oct 8.

Notch dimerization is required for leukemogenesis and T-cell development

Affiliations

Notch dimerization is required for leukemogenesis and T-cell development

Hudan Liu et al. Genes Dev. .

Abstract

Notch signaling regulates myriad cellular functions by activating transcription, yet how Notch selectively activates different transcriptional targets is poorly understood. The core Notch transcriptional activation complex can bind DNA as a monomer, but it can also dimerize on DNA-binding sites that are properly oriented and spaced. However, the significance of Notch dimerization is unknown. Here, we show that dimeric Notch transcriptional complexes are required for T-cell maturation and leukemic transformation but are dispensable for T-cell fate specification from a multipotential precursor. The varying requirements for Notch dimerization result from the differential sensitivity of specific Notch target genes. In particular, c-Myc and pre-T-cell antigen receptor α (Ptcra) are dimerization-dependent targets, whereas Hey1 and CD25 are not. These findings identify functionally important differences in the responsiveness among Notch target genes attributable to the formation of higher-order complexes. Consequently, it may be possible to develop a new class of Notch inhibitors that selectively block outcomes that depend on Notch dimerization (e.g., leukemogenesis).


Figures

Figure 1.
Figure 1.
R1985A induced T-cell specification from a MPP but failed to induce T-ALL. (A) Hematopoietic MPPs were purified from C57BL/6 BM and transduced with retroviruses (MigR1) expressing GFP alone or GFP and the indicated polypeptides for 48 h. Transduced cells were sorted by GFP expression and seeded at equal numbers (250 cells) onto OP9 stromal cells. Following 6 d of coculture with OP9, GFP+CD45+ cells were gated to evaluate the myeloid lineage by detecting the surface markers Mac1 and Gr1. Nonmyeloid cells (Mac1Gr1) were examined further for T-lineage development by Thy1.2 and CD25 expression. Gated live cells (DAPI) were analyzed and representative profiles are shown. (B) Relative numbers of Thy1.2+CD25+ cells generated from retrovirally transduced MPPs cocultured on OP9 were quantified and averaged from three independent experiments. Bars denote standard error of mean (SEM). P-values were determined by Student's t-test. (C) MPPs were transduced with retroviral vectors expressing the indicated cDNA and truncated nerve growth factor receptor (tNGFR) as a surrogate marker. Cells were labeled with CFSE and cultured on OP9 cells for 3 d. CFSE expression was determined on the CD45+NGFR+Thy1.2+CD25+ population. (D) Lethally irradiated mice were reconstituted with 5-FU-treated donor BM cells that were transduced with the MigR1 retroviral vector, ICN1, or R1985A. The Kaplan-Meier graph shows the fraction of mice without T-ALL as a function of time. MigR1 and ICN1 mice served as negative and positive controls, respectively. Peripheral blood from all mice was drawn 4 wk and 6 wk after BMT to follow T-ALL development. Only ICN1 mice were confirmed to develop T-ALL with an elevated white blood cell count (WBC >40 million cells per milliliter) containing >90% GFP+CD4+CD8+ DP T cells.
Figure 2.
Figure 2.
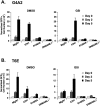
R1985A blocked Notch-dependent cell growth. G4A2 (A) or T6E (B) cells express a membrane-tethered mutated form of Notch1 that requires γ-secretase-dependent cleavage for activity. The cells were transduced with MigR1 retroviruses expressing GFP alone (MigR1) or GFP and the indicated polypeptides for 48 h, followed by treatment with the GSI JC-18 (1 μM) or vehicle (DMSO) for 5 d. GFP+ cell numbers, determined at each time point using a Vi-CELL Cell Viability Analyzer (Beckman Coulter) and FACS, are shown as the mean of values from triplicate wells ± SD. Cell numbers from 2 d and 5 d were normalized to 0 d. Data are representative of three independent experiments.
Figure 3.
Figure 3.
R1985A differentially influences Notch target gene expression. To measure the mRNA levels of direct Notch transcriptional targets, T6E cells were transduced with the indicated retroviruses for 15 h followed by 6 h of GSI treatment. The GFP+ population was sorted, followed by total RNA isolation and reverse transcription. Hey1 (A), CD25 (B), Hes1 (C), c-Myc (D), and pTα (E) transcript levels were measured by qPCR. The expression of each gene relative to 18s RNA is shown as the mean of values from triplicate wells ± SD. Representative data from three independent experiments are shown. The primers are described in the Materials and Methods.
Figure 4.
Figure 4.
Dimeric Notch1 directly regulates pTα transcription. (A) Schematic of the reported CSL-binding sites in both human and mouse pTα enhancers (left box in red) (Reizis and Leder 2002) and predicted cryptic second SPS sites (right box in blue). (B) Dimeric ICN1 transcriptional complex assembled in the presence of pTα enhancer. EMSA was performed with radiolabeled oligonucleotide probes, and the resulting complexes constituted with recombinant proteins are indicated. RA1 denotes the RAMANK domain of human ICN1. (C) Wild-type ICN1 but not R1985A fully induced human pTα enhancer. 293 cells were transiently transfected with the reporter constructs together with the ICN1 or R1985A expression vectors. The luciferase reporter constructs contained the indicated enhancer fragments upstream of the SV40 promoter TATA box. The human pTα enhancers were either wild type or mutated at the CSL-binding sites as described (Reizis and Leder 2002). Reporter activities normalized to an empty vector were determined and presented as fold induction, shown as the mean of values from triplicate wells ± SD. Data are representative of three independent experiments. (D) Key interactions between symmetry mates in the structure of the Notch transcription complex (Protein Data Bank ID code 2F8X). One of the symmetry-related Notch ankyrin domains is colored blue, and the other is pink. Residues that form contacts between symmetry mates are labeled. The pink copy also has a transparent molecular surface. Dotted lines denote salt bridges between K1946 and E1950′ and E1950 and K1946′. The different K1946 and E1950 mutants used to analyze Notch dimerization are shown on the right. Predicted salt bridges are indicated by the dashed red lines. (E) Induction of the human pTα enhancer by both wild-type ICN1 and a variant containing dual mutations (K1946E/E1950K). Similar to the transfections in C, the luciferase reporter construct containing the human pTα enhancer upstream of the SV40 promoter TATA box was coexpressed with the indicated ICN1 and mutants. Reporter activities were determined and normalized to the empty vector as induction fold, shown as the mean of values from triplicate wells ± SD. Data are representative of three independent experiments.
Figure 5.
Figure 5.
c-Myc overrides the R1985A-induced block in DP T-cell development. (A) R1985A failed to activate c-Myc expression in primary DN3 thymocytes. DN3 cells were sorted from the thymus of B6 mice and transduced with the indicated retroviral supernatants. At 16 h post-transduction, the transduced DN3 cells were purified and cocultured with OP9 cells for 2 d, then RNA was obtained to analyze gene expression by qPCR. c-Myc and Hey1 expression relative to 18s RNA is shown as the mean of values from triplicate wells ± SD. Data are representative of two independent experiments. (B) Purified DN3 cells were transduced with the indicated pairs of retroviruses and 200 NGFR+GFP+ cells were sorted and cultured with OP9 cells for 9 d, whereupon the CD45+ cells were immunophenotyped for CD4 and CD8 expression. Thymocytes from a C57BL/6 mouse were analyzed as controls to gate CD4+CD8+ and CD4CD8 populations (data not shown). The percentage of cells in the bottom left and top right quadrants is shown. Representative profiles are shown. Gated live cells (DAPI) were analyzed. Experiments were performed at least three times with similar results. (C) CD4+CD8+ cells generated from retrovirally transduced DN3 cells in B were quantified. The cell number in each condition is shown as the mean of values from triplicate wells ± SD. Data are representative of three independent experiments. (D) DN3 cells were transduced with retroviral vectors expressing the indicated cDNA and tNGFR as a surrogate marker. Cells were labeled with CFSE and cultured on OP9 cells for 5 d. CFSE levels were determined on the indicated CD45+NGFR+CD4CD8 and CD45+NGFR+CD4+CD8+ populations.
Figure 6.
Figure 6.
Notch dimerization regulates c-Myc and pTα expression in vivo. (A) Exogenous c-Myc expression maintained growth of R1985A-expressing 8946 cells. 8946 cells were transduced with pairs of retroviruses that expressed either GFP or tNGFR as surrogate markers for 48 h, followed by doxycycline (20 ng/mL) treatment for 6 d. GFP+NGFR+ cell numbers were determined at each time point and are shown as the mean of values from triplicate wells ± SD. Cell numbers from 2 d and 6 d were normalized to that from 0 d. Data are representative of three independent experiments. (B,C) 8946 cells were transduced with viruses expressing ICN1 or the indicated mutants for 24 h, then treated with doxycycline (20 ng/mL) for an additional 24 h. The sorted GFP+ cells were harvested and RNA was obtained to analyze gene expression by qPCR. c-Myc (B) and pTα (C) expression relative to 18s RNA are shown as the mean of values from triplicate wells ± SD. Representative data from two independent experiments are shown. (D) The remaining cells were maintained in doxycycline (20 ng/mL) treatment for up to 14 d. GFP+NGFR+ cell numbers, determined at the indicated times using a Vi-CELL Cell Viability Analyzer (Beckman Coulter) and FACS, are shown as the mean of values from triplicate wells ± SD. Cell numbers from 2 d, 7 d, and 14 d were normalized to 0 d. Data are representative of two independent experiments.
Figure 7.
Figure 7.
Models of dimerization-dependent or independent Notch transcription. (CBS) CSL-binding site. Notch1 transcriptional targets such as Hey1 do not require dimerization, whereas others, such as c-Myc and pTα, are dimerization-dependent. SPSs in pTα are shown to locate in its enhancer, constituted by a canonical CSL-binding site and a cryptic site 16 bp downstream apart. The location of the SPS sites in c-Myc is not yet determined. Hes1 transcription is predicted to depend on Notch binding as both a monomer and dimer.

Similar articles

Cited by

References

    1. Aifantis I, Mandal M, Sawai K, Ferrando A, Vilimas T 2006. Regulation of T-cell progenitor survival and cell-cycle entry by the pre-T-cell receptor. Immunol Rev 209: 159–169 - PubMed
    1. Allman D, Karnell FG, Punt JA, Bakkour S, Xu L, Myung PS, Koretzky GA, Pui JC, Aster JC, Pear WS 2001. Separation of Notch1 promoted lineage commitment and expansion/transformation in developing T cells. J Exp Med 194: 99–106 - PMC - PubMed
    1. Arnett KL, Hass M, McArthur DG, Aster JC, Kopan R, Blacklow SC 2010. Structural and mechanistic insights into cooperative assembly of dimeric Notch transcription complexes. Nat Struct Mol Biol (in press) - PMC - PubMed
    1. Artavanis-Tsakonas S, Rand MD, Lake RJ 1999. Notch signaling: Cell fate control and signal integration in development. Science 284: 770–776 - PubMed
    1. Aster JC, Xu L, Karnell FG, Patriub V, Pui JC, Pear WS 2000. Essential roles for ankyrin repeat and transactivation domains in induction of T-cell leukemia by Notch1. Mol Cell Biol 20: 7505–7515 - PMC - PubMed

Publication types

MeSH terms

LinkOut - more resources