

Arachidonic acid: an evolutionarily conserved signaling molecule modulates plant stress signaling networks
- PMID: 20935246
- PMCID: PMC2990140
- DOI: 10.1105/tpc.110.073858
Arachidonic acid: an evolutionarily conserved signaling molecule modulates plant stress signaling networks
Abstract
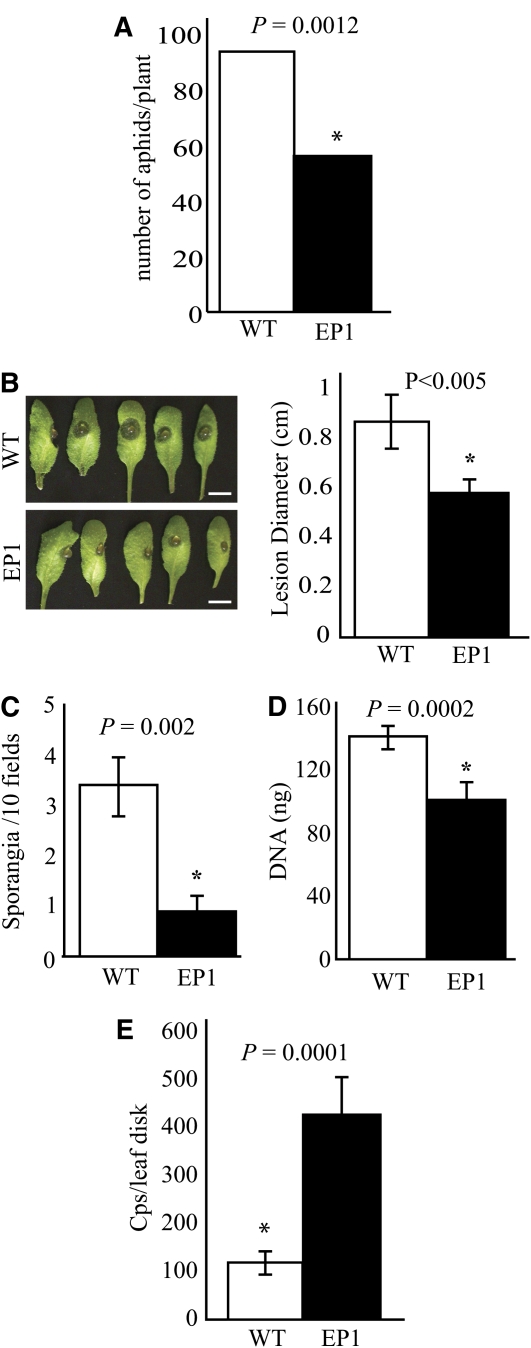
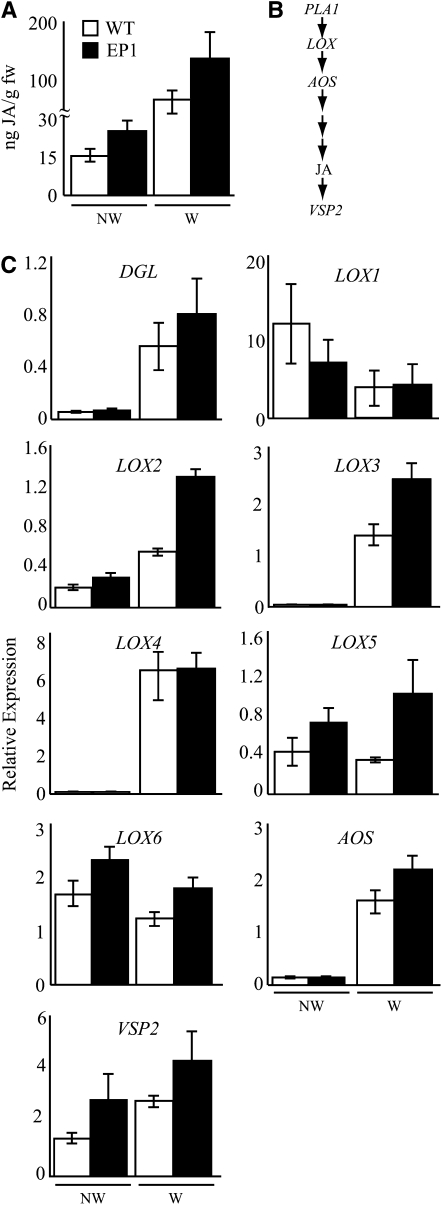
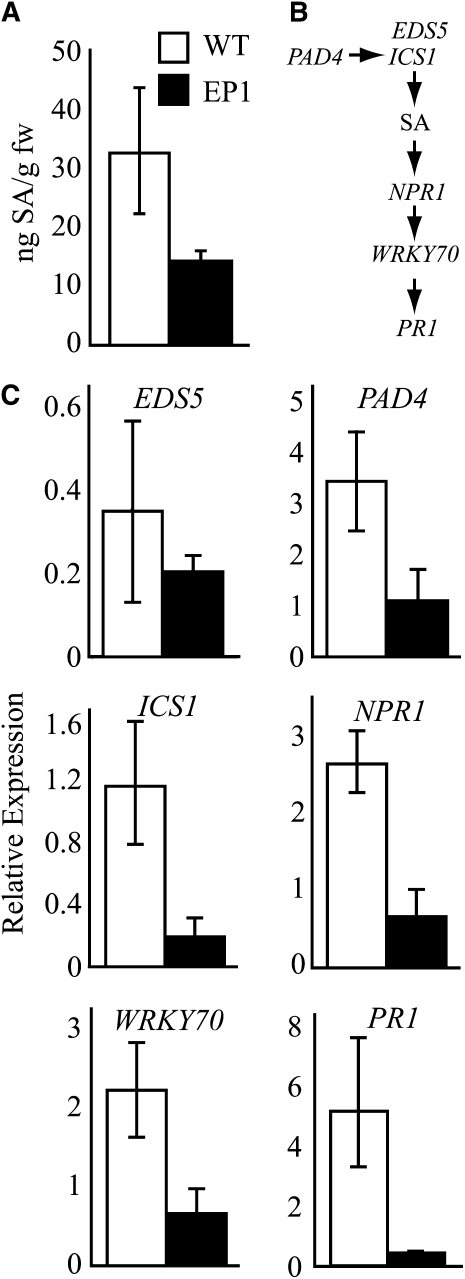
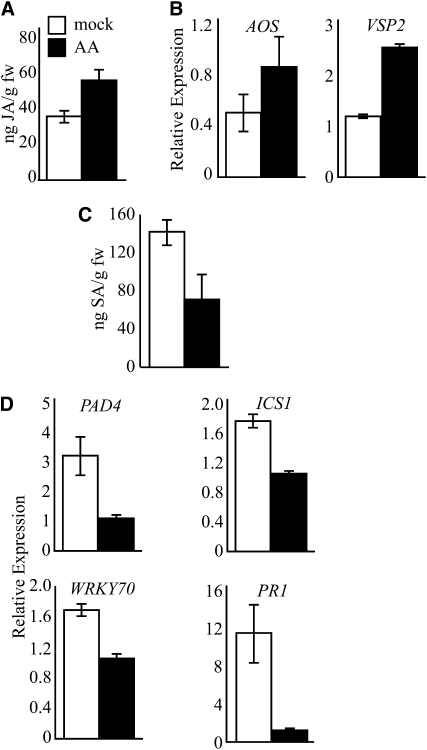
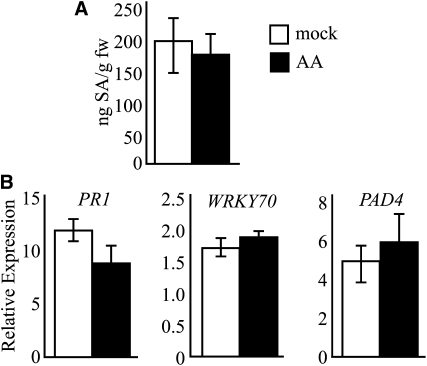
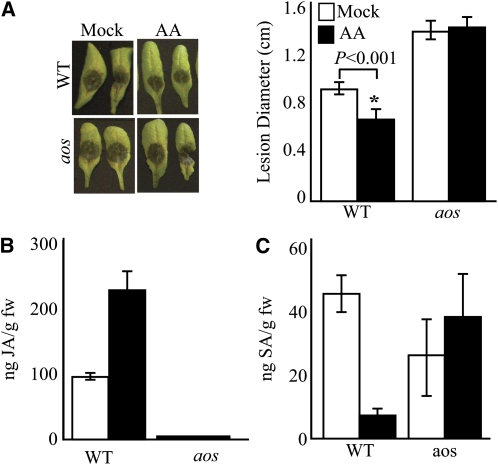
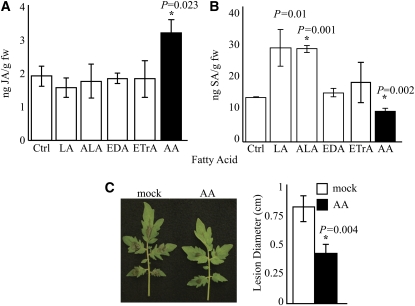
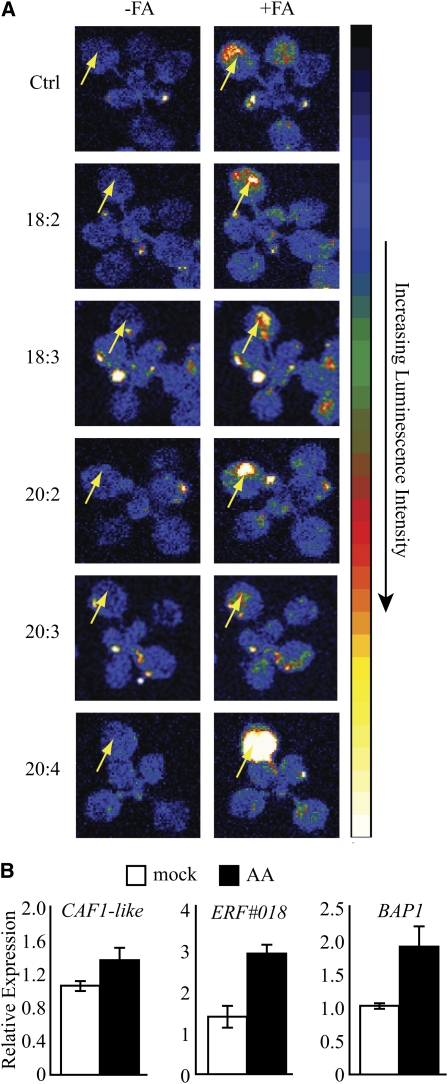
Fatty acid structure affects cellular activities through changes in membrane lipid composition and the generation of a diversity of bioactive derivatives. Eicosapolyenoic acids are released into plants upon infection by oomycete pathogens, suggesting they may elicit plant defenses. We exploited transgenic Arabidopsis thaliana plants (designated EP) producing eicosadienoic, eicosatrienoic, and arachidonic acid (AA), aimed at mimicking pathogen release of these compounds. We also examined their effect on biotic stress resistance by challenging EP plants with fungal, oomycete, and bacterial pathogens and an insect pest. EP plants exhibited enhanced resistance to all biotic challenges, except they were more susceptible to bacteria than the wild type. Levels of jasmonic acid (JA) were elevated and levels of salicylic acid (SA) were reduced in EP plants. Altered expression of JA and SA pathway genes in EP plants shows that eicosapolyenoic acids effectively modulate stress-responsive transcriptional networks. Exogenous application of various fatty acids to wild-type and JA-deficient mutants confirmed AA as the signaling molecule. Moreover, AA treatment elicited heightened expression of general stress-responsive genes. Importantly, tomato (Solanum lycopersicum) leaves treated with AA exhibited reduced susceptibility to Botrytis cinerea infection, confirming AA signaling in other plants. These studies support the role of AA, an ancient metazoan signaling molecule, in eliciting plant stress and defense signaling networks.
Figures
Similar articles
-
Role of dioxygenase α-DOX2 and SA in basal response and in hexanoic acid-induced resistance of tomato (Solanum lycopersicum) plants against Botrytis cinerea.J Plant Physiol. 2015 Mar 1;175:163-73. doi: 10.1016/j.jplph.2014.11.004. Epub 2014 Nov 26. J Plant Physiol. 2015. PMID: 25543862
-
Ultraviolet radiation enhances salicylic acid-mediated defense signaling and resistance to Pseudomonas syringae DC3000 in a jasmonic acid-deficient tomato mutant.Plant Signal Behav. 2019;14(4):e1581560. doi: 10.1080/15592324.2019.1581560. Epub 2019 Feb 20. Plant Signal Behav. 2019. PMID: 30782061 Free PMC article.
-
Plastidial fatty acid signaling modulates salicylic acid- and jasmonic acid-mediated defense pathways in the Arabidopsis ssi2 mutant.Plant Cell. 2003 Dec;15(12):2952-65. doi: 10.1105/tpc.017301. Epub 2003 Nov 13. Plant Cell. 2003. PMID: 14615603 Free PMC article.
-
Ethylene as a modulator of disease resistance in plants.Trends Plant Sci. 2006 Apr;11(4):184-91. doi: 10.1016/j.tplants.2006.02.005. Epub 2006 Mar 10. Trends Plant Sci. 2006. PMID: 16531096 Review.
-
β-glucans and eicosapolyenoic acids as MAMPs in plant-oomycete interactions: past and present.Front Plant Sci. 2015 Jan 13;5:797. doi: 10.3389/fpls.2014.00797. eCollection 2014. Front Plant Sci. 2015. PMID: 25628639 Free PMC article. Review.
Cited by
-
Transcriptomic Complexity in Strawberry Fruit Development and Maturation Revealed by Nanopore Sequencing.Front Plant Sci. 2022 Jul 13;13:872054. doi: 10.3389/fpls.2022.872054. eCollection 2022. Front Plant Sci. 2022. PMID: 35909727 Free PMC article.
-
Cell Wall Acetylation in Hybrid Aspen Affects Field Performance, Foliar Phenolic Composition and Resistance to Biological Stress Factors in a Construct-Dependent Fashion.Front Plant Sci. 2020 May 25;11:651. doi: 10.3389/fpls.2020.00651. eCollection 2020. Front Plant Sci. 2020. PMID: 32528503 Free PMC article.
-
Uncovering plant-pathogen crosstalk through apoplastic proteomic studies.Front Plant Sci. 2014 Jun 3;5:249. doi: 10.3389/fpls.2014.00249. eCollection 2014. Front Plant Sci. 2014. PMID: 24917874 Free PMC article. Review.
-
Targeted metabolomics shows plasticity in the evolution of signaling lipids and uncovers old and new endocannabinoids in the plant kingdom.Sci Rep. 2017 Jan 25;7:41177. doi: 10.1038/srep41177. Sci Rep. 2017. PMID: 28120902 Free PMC article.
-
Multi-Omics of Tomato Glandular Trichomes Reveals Distinct Features of Central Carbon Metabolism Supporting High Productivity of Specialized Metabolites.Plant Cell. 2017 May;29(5):960-983. doi: 10.1105/tpc.17.00060. Epub 2017 Apr 13. Plant Cell. 2017. PMID: 28408661 Free PMC article.
References
-
- Black P.N., Faergeman N.J., DiRusso C.C. (2000). Long-chain acyl-CoA-dependent regulation of gene expression in bacteria, yeast and mammals. J. Nutr. 130: 305S–309S - PubMed
-
- Blee E. (2002). Impact of phyto-oxylipins in plant defense. Trends Plant Sci. 7: 315–322 - PubMed
-
- Bostock R.M. (2005). Signal crosstalk and induced resistance: Straddling the line between cost and benefit. Annu. Rev. Phytopathol. 43: 545–580 - PubMed
-
- Bostock R.M., Kuc J.A., Laine R.A. (1981). Eicosapentaenoic and arachidonic acids from Phytophthora infestans elicit fungitoxic sesquiterpenes in the potato. Science 212: 67–69 - PubMed
-
- Bostock R.M., Schaeffer D.A., Hammerschmidt R. (1986). Comparison of elicitor activities of arachidonic acid, fatty acids and glucans from Phytophthora infestans in hypersensitivity expression in potato tuber. Physiol. Mol. Plant Pathol. 29: 349–360
Publication types
MeSH terms
Substances
LinkOut - more resources
Full Text Sources
