. 2010 Dec 1;10(11):1126-36.
doi: 10.4161/cbt.10.11.13438. Epub 2010 Dec 1.

Inhibition of NADPH oxidase by glucosylceramide confers chemoresistance

Affiliations

Inhibition of NADPH oxidase by glucosylceramide confers chemoresistance

Brian M Barth et al. Cancer Biol Ther. .

Abstract

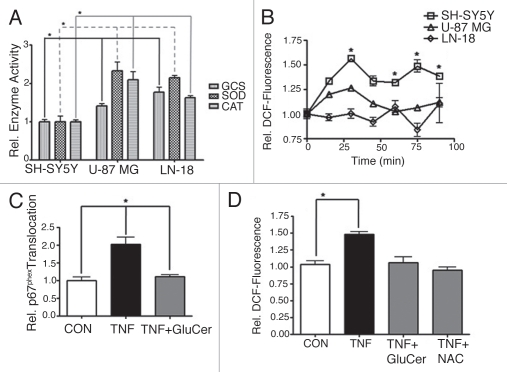
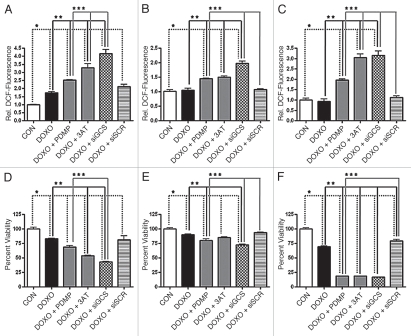
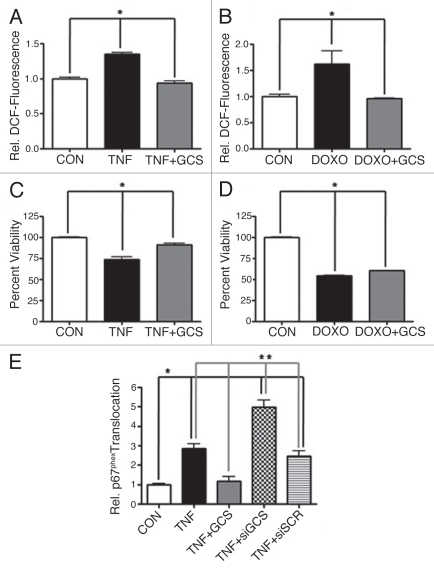
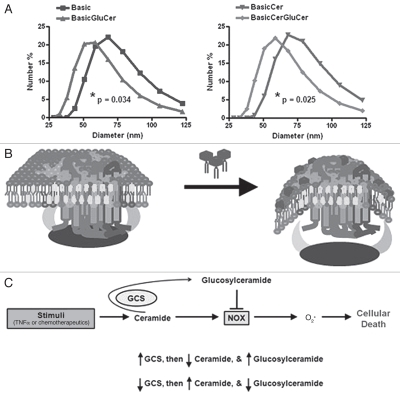
The bioactive sphingolipid ceramide induces oxidative stress by disrupting mitochondrial function and stimulating NADPH oxidase (NOX) activity, both implicated in cell death mechanisms. Many anticancer chemotherapeutics (anthracyclines, Vinca alkaloids, paclitaxel, and fenretinide), as well as physiological stimuli such as tumor necrosis factor α (TNFα), stimulate ceramide accumulation and increase oxidative stress in malignant cells. Consequently, ceramide metabolism in malignant cells and, in particular the up-regulation of glucosylceramide synthase (GCS), has gained considerable interest in contributing to chemoresistance. We hypothesized that increases in GCS activity and thus glucosylceramide, the product of GCS activity, represents an important resistance mechanism in glioblastoma. In our study, we determined that increased GCS activity effectively blocked reactive oxygen species formation by NOX. We further showed, in both glioblastoma and neuroblastoma cells that glucosylceramide directly interfered with NOX assembly, hence delineating a direct resistance mechanism. Collectively, our findings indicated that pharmacological or molecular targeting of GCS, using non-toxic nanoliposome delivery systems, successfully augmented NOX activity, and improved the efficacy of known chemotherapeutic agents.


Figures

Figure 1
Figure 1
Chemotherapeutics stimulate NOX-dependent intracellular ROS production. The production of intracellular ROS was evaluated using the redox-sensitive indicator H2DCFDA in human SH-SY5Y neuroblastoma cells. Diphenylene iodonium (DPI, 10 µM, 60 min pretreatment), an inhibitor of NOX, was utilized to demonstrate the NOX-dependence of ROS production in response to various chemotherapeutics. (A) Doxorubicin (DOXO, 8.6 µM, 90 min). (B) Paclitaxel (PCT, 100 nM, 60 min). (C) 4-hydroxy tamoxifen (4OHT, 7.4 µM, 90 min). (D) Methotrexate (MTX, 1 µM, 60 min). (E) Gemcitabine (GEM, 1 µM, 120 min). (F) Fenretinide (4HP R, 1.5 µM, 60 min). (G) Empty (ghost) nanoliposomes (lipGH, 60 min). (H) Nanoliposomes containing 5 µM C6-ceramide (lipC6, 60 min). (I) Nanoliposomes containing both 5 µM C6-ceramide and 5 µM PDMP (lipC6/PDMP, 60 min). Fluorescence, corresponding to ROS, was normalized to the average fluorescence of the control (relative DCF-fluorescence). Data represent the mean ± SEM of four independent experiments; *p < 0.05, **p < 0.01 or ***p < 0.001, as determined by 1-way ANOVA.
Figure 2
Figure 2
Glucosylceramide blocks agonist-stimulated NOX activity. (A) Basal activities of catalase (CAT), superoxide dismutase (SOD) and glucosylceramide synthase (GCS) were compared between human SH-SY5Y neuroblastoma, U-87 MG glioblastoma and LN-18 glioblastoma cells. Activities were normalized to the average activities of SH-SY5Y cells. Data represent the mean ± SEM of at least three independent experiments; *p < 0.05, as determined by 1-way ANOVA. (B) The redox-sensitive indicator H2DCFDA was used to compare production of intracellular ROS between SH-SY5Y, U-87 MG or LN-18 cells in response to doxorubicin (8.6 µM). Fluorescence, corresponding to ROS, was normalized to the average 0-min fluorescence of the respective cell line (relative DCF-fluorescence). Data represent the mean ± SEM of three independent experiments; *p < 0.05, as determined by 2-way ANOVA, comparing SH-SY5Y response to both U-87 MG and LN-18 response. (C) Translocation of p67phox to the plasma membrane was evaluated as an indication of NOX assembly. SH-SY5Y cells were exposed to TNFα (TNF, 100 ng/ml, 15 min) ±60 min pretreatment with exogenous C8-glucosylceramide (GluCer, 10 µM). Translocation was normalized to the average translocation of the control. Data represent the mean ± SEM of three independent experiments; *p < 0.01, as determined by 1-way ANOVA. (D) Intracellular ROS production was evaluated in SH-SY5Y cells exposed to TNFα (TNF, 100 ng/ml, 60 min) ±60 min pretreatment with GluCer (10 µM) or the antioxidant N-acetyl-L-cysteine (NAC, 5 mM). Data represent the mean ± SEM of three independent experiments; *p < 0.01, as determined by 1-way ANOVA.
Figure 3
Figure 3
Interference with GCS augments intracellular ROS production and improves chemotherapy-induced cell death. Cells were exposed to doxorubicin (DOXO, 8.6 µM) ±2 h pretreatment with the GCS inhibitor PDMP (10 µM) or the catalase inhibitor 3-amino-1,2,4-triazole (3AT, 1 mM). Alternatively, cells were transfected with 200 nM siRNA directed against GCS (siGCS) or non-targeted siRNA (siSCR), 48 hours prior to treatment. The production of intracellular ROS was examined after 90 min treatment in human SH-SY5Y neuroblastoma, U-87 MG glioblastoma or LN-18 glioblastoma cells, using the redox-sensitive indicator H2DCFDA, while cellular viability was determined after 48 hour treatment by XTT assay. Fluorescence, corresponding to ROS, was normalized to the average fluorescence of the control (relative DCF-fluorescence). (A) ROS in SH-SY5Y cells. (B) ROS in U-87 MG cells. (C) ROS in LN-18 cells. (D) Viability of SH-SY5Y cells. (E) Viability of U-87 MG cells. (F) Viability of LN-18 cells. Data represent the mean ± SEM of four independent experiments; *p < 0.05 compared to control (CON), **p < 0.05 compared to DOXO, ***p < 0.05 compared to DOXO + PDMP, as determined by 1-way ANOVA.
Figure 4
Figure 4
Overexpression of GCS blocks NOX and improves survival. Human SH-SY5Y neuroblastoma cells were transfected with 3 µg/ml of a GCS-expressing plasmid, 200 nM siRNA directed against GCS (siGCS) or non-targeted siRNA (siSCR), 48 hours prior to treatment. The production of intracellular ROS was evaluated using the redox-sensitive indicator H2DCFDA, while cellular viability was determined by XTT assay. Fluorescence, corresponding to ROS, was normalized to the average fluorescence of the control (relative DCF-fluorescence). (A) ROS in cells exposed to TNFα (TNF, 100 ng/ml, 60 min). (B) ROS in cells exposed to doxorubicin (DOXO, 8.6 µM, 90 min). (C) Viability of cells exposed to TNFα (TNF, 100 ng/ml, 48 h). (D) Viability of cells exposed to doxorubicin (DOXO, 8.6 µM, 48 h). Data represent the mean ± SEM of four (viability) or five (ROS), independent experiments; *p < 0.05, as determined by 1-way ANOVA. (E) Translocation of p67phox to the plasma membrane was evaluated as an indication of NOX assembly. Translocation was normalized to the average translocation of the control and represent the mean ± SEM of three independent experiments; *p < 0.05 compared to control (CON), **p < 0.01 compared to TNF + siGCS, as determined by 1-way ANOVA.
Figure 5
Figure 5
Glucosylceramide prevents NOX activity by altering membrane curvature. Liposomes were prepared as a model of the plasma membrane, and the effect on membrane curvature with glucosylceramide addition was evaluated. (A) Liposomes composed of phospholipids, cholesterol, and sphingomyelin (basic formulation), with or without ceramide, were compared to equivalent counterparts containing glucosylceramide. Size of liposomes, related to curvature (curvature = 1/radius), was determined by light scattering. Data represent the mean of three independent experiments. Significance was determined by unpaired t-test of the mean diameter of respective liposomes. (B) Model depicting the addition of glucosylceramide inducing positive membrane curvature, which restricts the ability of NOX cytosolic components to interact with essential membrane lipids (glucosylceramide: dark hexagons with tails). (C) Schematic depicting that TNFα, or chemotherapeutics, stimulates NOX through ceramide generation, and that neutralization to glucosylceramide directly blocks NOX while also depleting ceramide.

References

    1. Andrieu-Abadie N, Gouaze V, Salvayre R, Levade T. Ceramide in apoptosis signaling: Relationship with oxidative stress. Free Radic Biol Med. 2001;31:717–728. - PubMed
    1. Ogretmen B, Hannun YA. Biologically active sphingolipids in cancer pathogenesis and treatment. Nat Rev Cancer. 2004;4:604–616. - PubMed
    1. Zheng W, Kollmeyer J, Symolon H, Momin A, Munter E, Wang E, et al. Ceramides and other bioactive sphingolipid backbones in health and disease: Lipidomic analysis, metabolism and roles in membrane structure, dynamics, signaling and autophagy. Biochim Biophys Acta. 2006;1758:1864–1884. - PubMed
    1. Bedard K, Krause KH. The NOX family of ROS-generating NADPH oxidases: Physiology and pathophysiology. Physiol Rev. 2007;87:245–313. - PubMed
    1. Cacicedo JM, Benjachareowong S, Chou E, Ruderman NB, Ido Y. Palmitate-induced apoptosis in cultured bovine retinal pericytes: Roles of NAD(P)H oxidase, oxidant stress and ceramide. Diabetes. 2005;54:1838–1845. - PubMed

Publication types

MeSH terms