. 2010 Nov;11(11):1014-22.
doi: 10.1038/ni.1944. Epub 2010 Oct 10.

IL-37 is a fundamental inhibitor of innate immunity

Affiliations

IL-37 is a fundamental inhibitor of innate immunity

Marcel F Nold et al. Nat Immunol. 2010 Nov.

Abstract

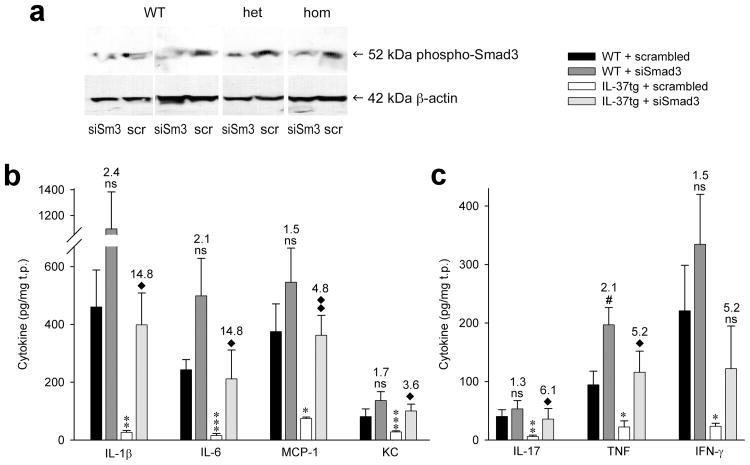
The function of interleukin 37 (IL-37; formerly IL-1 family member 7) has remained elusive. Expression of IL-37 in macrophages or epithelial cells almost completely suppressed production of pro-inflammatory cytokines, whereas the abundance of these cytokines increased with silencing of endogenous IL-37 in human blood cells. Anti-inflammatory cytokines were unaffected. Mice with transgenic expression of IL-37 were protected from lipopolysaccharide-induced shock, and showed markedly improved lung and kidney function and reduced liver damage after treatment with lipopolysaccharide. Transgenic mice had lower concentrations of circulating and tissue cytokines (72-95% less) than wild-type mice and showed less dendritic cell activation. IL-37 interacted intracellularly with Smad3 and IL-37-expressing cells and transgenic mice showed less cytokine suppression when endogenous Smad3 was depleted. IL-37 thus emerges as a natural suppressor of innate inflammatory and immune responses.


Conflict of interest statement

The authors have no conflicting financial interests.

Figures

Figure 1
Figure 1
Production and silencing of endogenous IL-37 in human PBMCs. (a, left) immunoblot of PBMC lysates after 20 h. One of 4 donors is depicted. Concentrations (ng/ml) are: IL-10, 25; IL-1β, 10; IL-12, 20; IL-18, 25; IL-32γ, 5; IFN-γ, 25; TNF, 20; TGF-β1, 20; LPS as indicated; Pam, 10; CpG, 1000; IL-4, 20; GM-CSF, 40. (a, right) Before staining, anti-IL-37 was mixed with 1 μg/ml recombinant human IL-37b (right). (b) immunoblot of lysates from two donors 24 h after incubation with 1 μg/ml of LPS. 20 h prior, PBMCs were transfected with 100 nM of siIL-37 or scrambled siRNA. Two of five similar blots are shown. (c-e) 24 h after transfections, PBMCs were stimulated with 1 μg/ml LPS, 10 ng/ml Pam3CSK4, or left untreated for 24 h. Mean ± SEM concentrations of secreted IL-1β, IL-6, and IL-10 are shown (n = 7; ns, not significant; *, P < 0.05; **, P < 0.01; and ***, P < 0.001 for siIL-37 compared to scrambled). The numbers above and next to the bars indicate fold changes and P-values, respectively. (f) PBMCs were transfected with either 100 nM siIL-37 (open bars) or scrambled siRNA (closed bars) and stimulated with 1 μg/ml LPS. After 24 h, pairs of siIL-37/scrambled siRNA from 3 donors were assessed by cytokine protein array. The graph depicts the results of densitometric analysis as normalized density/mm2 ± SEM; *, P < 0.05; **, P < 0.01. Numbers indicate percent decrease or fold increase. Color code: Blue, mean increase > 2-fold; green, mean increase 1.5- to 2-fold; black, small changes. (g) Immunohistochemical staining of IL-37 in synovial tissue from a rheumatoid arthritis patient with active disease. (h) Staining of the same tissue with a rabbit IgG control antibody. The panels are representative for 5 similar pairs of images.
Figure 2
Figure 2
Effect of TLR-induced IL-37b on cytokine production in RAW cells. (a) Immunoblots of RAW-IL-37 cells. Cells were incubated without (ctrl) or with increasing concentrations of LPS (left) or TLR ligands (right) for 24 h. Each blot represents one of four independently performed experiments. TLR ligands (in μg/ml) are indicated. Supernatants (b,c) or lysates (d) of LPS-stimulated cells were prepared. The panels depict means of absolute concentrations of cytokines normalized to total protein (t.p.) ± SEM, n = 8. Mock-transfected, filled symbols; RAW-IL-37 (= C17), open symbols; *, P < 0.05; **, P < 0.01; ***, P < 0.001 for RAW-IL-37 compared to mock-transfected. Absolute P-values are shown. IL-37b was absent in lysates of mock-transfected cells (not shown). (e) Protein array analysis of supernatants from RAW-IL-37 (open bars) and mock-transfected cells (closed bars) stimulated with LPS (100 ng/ml) for 24 h. Mean densities of RAW-IL-37 vs mock-transfected cells were obtained from 3 independently performed experiments. Results are shown as density/mm2 ± SEM; *, P < 0.05; **, P < 0.01. Red indicates a mean reduction of more than 67%, orange symbolizes a decrease between 33 and 67%. Cytokines with little change are displayed by black bars.
Figure 3
Figure 3
Cytokine production in THP-1 (a-c) and A549 (d-f) cells transfected with IL-37b. Cells were transfected with either the pIRES-IL-37b plasmid or mock-transfected with pIRES lacking IL-37b. (a,b) IL-1β and TNF levels in undifferentiated, transiently transfected THP-1 stimulated with either 1 μg/ml LPS, 25 ng/ml IL-1β, or vehicle as indicated. (c) Absolute TNF levels in PMA-differentiated, transfected THP-1 stimulated with either LPS, IL-1β, or vehicle as indicated. (a-c) n = 6; *, P < 0.05; **, P < 0.01; ***, P < 0.001 for mock-transfected vs. IL-37b expression. Individual P-values are shown above the open bars. (d-f) A549 lung epithelial cells transfected in with either pIRES-IL-37b or mock transfected. (d) Immunoblot of IL-37b in non-transfected (“no”) or transfected A549 cells; IL-37b-ex, IL-37b expression plasmid; mock, empty vector. One representative of four similar blots is shown. (e,f) IL-6 and IL-1α levels in IL-1β-stimulated (10 ng/ml) A549 cells following transfection with either the mock plasmid or the IL-37b construct. Absolute cytokine values (mean ± SEM) are indicated; n = 5; ns, not significant; **, P < 0.01; ***, P < 0.001. P-values are shown above the open bars.
Figure 4
Figure 4
Smad3 and IL-37. (a) Confocal microscopy of IL-37b-transfected A549 cells treated either with 10 ng/ml IL-1β or vehicle. Localization of IL-37b/FLAG (Cy3, yellow), phospho-Smad3 (FITC, green), cell membranes (Alexa Fluor 633, red), and nuclei (DAPI, blue, shown only in overlays) are shown. Bright yellow in the overlay images indicates colocalization. See Supplementary Fig. 3 for mock-transfected cells. (b) Anti-FLAG immunoprecipitation of IL-37b-transfected A549 cells stimulated with IL-1β (10 ng/ml) followed by non-reducing PAGE and immunoblotting with anti-Smad3. (c,d) SIS3 (in μM) was added to cultures of either RAW cell clones (c) or transfected and differentiated THP-1 macrophages (d) 30 min before the addition of LPS. IL-6 (c), and IL-1β (d) levels in culture supernatants after 24 h. (c) Mean ± SEM percent changes from LPS (100 ng/ml) alone, n = 6; *, P < 0.05 and **, P < 0.01 for RAW-IL-37 vs. mock-transfected cells. Numbers above open bars are P-values. (d) LPS and SIS3 were used at 1000 ng/ml and 2 μM, respectively. The graph depicts absolute IL-1β concentrations ± SEM, n = 4; numbers indicate fold-increases induced by SIS3 treatment and P-values. ns, not significant; **, P < 0.01 for increases in IL-1β production in mock-transfected vs. IL-37b-transfected THP-1 cells. (e) Mean ± SEM IL-8 in THP-1 cells stably transfected with shRNA to Smad3 (shSmad3) or scrambled (eLV) following transfection with the IL-37b construct or the control vector and stimulated with 25 ng/ml IL-1β or 1000 ng/ml LPS (n = 4, **, P < 0.01 and ***, P < 0.001 for mock-transfected vs. IL-37b expression).
Figure 5
Figure 5
Amelioration of endotoxic shock in mice transgenic for IL-37b. (a) Immunoprecipitation with anti-FLAG and anti-IL-37 and immunoblotting of lysates of splenocytes from several F1 generation IL-37tg and 4 PCR-negative littermates (neg). Splenocytes were incubated either with or without LPS (1 μg/ml) for 20 h. The data from one representative neg and three IL-37tg heterozygotes (het) are shown. (b) IL-37tg heterozygotes were injected with 10 mg/kg LPS or vehicle. 24 h later, peripheral blood was obtained and IL-37b was analyzed by immunoblotting. The panel shows staining against IL-37 from two representative pairs of vehicle- or LPS-injected mice. (c-k) 23 IL-37tg heterozygous, 10 homozygous, and 25 wild-type and neg mice were injected with 10 mg/kg LPS or vehicle. Means ± SEM are depicted; *, P < 0.05; **, P < 0.01; ***, P < 0.001 for wild-type and neg compared to IL-37tg as per one way ANOVA or one way ANOVA on ranks. The dash-dot lines indicate average levels in vehicle-injected IL-37tg, wild-type, and neg (between which no difference was observed) ± SEM, n = 5 heterozygotes, 3 homozygotes, and 5 neg-WT. (c) Body temperature was measured at the indicated time points. Actual P-values: IL-37tg homozygotes: 4 h, 0.025; 6, 9, and 24 h, < 0.001; IL-37tg heterozygotes: 6 h, 0.029; 9 h, 0.046; 24 h, 0.022. (d-k) After 24 h, plasma was harvested and blood gases (d-g), electrolytes (h,i), and liver enzymes (j,k) were determined.
Figure 6
Figure 6
Production of LPS-induced cytokines in IL-37tg mice. IL-37tg as well as wild-type and neg mice were injected with 10 mg/kg LPS or vehicle. 24 h later, plasma (a-c) and lungs (d, e) were obtained and analyzed by electrochemiluminescence assay or ELISA (b-e), or protein array (a). The mice used to create Fig. 6 are identical with those used for Fig. 5. (a) Protein array analysis was performed on the plasma of three IL-37tg heterozygous (open bars) and four wild-type or neg (closed bars) mice. The results of the densitometry are depicted as normalized density/mm2 ± SEM; *, P < 0.05; **, P < 0.01; ***, P < 0.001. Numbers indicate percent decrease or fold increase. Color code: Red, mean decrease > 67%; orange, mean decrease 33 to 67%; black, small changes (−33% decrease to +50% or 1.5-fold increase); green, 1.5- to 2-fold increase; blue, > 2-fold increase. (b-e) The graphs depict absolute values ± SEM in 23 IL-37tg heterozygotes, 10 homozygotes, and 25 wild-type and neg mice; *, P < 0.05; **, P < 0.01; ***, P < 0.001 for IL-37tg het or hom vs neg-WT. For all individual P-values in this Figure and statistical tests performed, see Supplementary Table 2.
Figure 7
Figure 7
Cytokines and DC activation in IL-37tg and neg-WT spleens and whole blood. (a-c) Spleens were harvested from the same mice shown in Fig. 6 (i.e. 24 h after injection of 10 mg/kg LPS or vehicle) and either lysed and analyzed for cytokine levels (a) or incubated with collagenase IV, stained, and subjected to flow-cytometry (b,c). (a) Electrochemiluminescence and ELISA measurements of the indicated cytokines depicted as cytokine concentration ± SEM normalized to total protein (t.p.); *, P < 0.05; **, P < 0.01; ***, P < 0.001; actual P-values: MIP-1α, 0.002; MIP-2, 0.014; IL-1α, 0.28; IL-1β, 0.021; IL-6 and TGF-β1 < 0.001. (b,c) CD11c+ DC were identified in the viable splenocytes and then analyzed for expression of CD86 and MHC II; n = 11 LPS and 4 vehicle neg-WT, 8 LPS and 5 vehicle IL-37tg heterozygotes (het), and 9 LPS and 5 vehicle IL-37tg homozygotes (hom); **, P < 0.01 for neg-WT vs IL-37tg hom. (b) Statistical assessment of DC activation displayed as CD86+MHC II+ DC among total DC in percent in LPS- and vehicle-injected mice. Horizontal lines show means. (c) Exemplary scatter plot of one LPS-injected mouse from each strain. Percent of CD86/MHC II double-positive cells is indicated in right upper corner. (d,e) Whole blood was obtained from IL-37tg heterozygotes and neg-WT, was stimulated as indicated (concentrations in ng/ml: LPS, 1000; IL-12, 20; IL-1β, 20; TNF, 20; IL-18, 50), and incubated for 20 h. The data depict mean ± SEM of absolute cytokine concentrations in picograms per million white blood cells. n = 6 IL-37tg and 8 neg-WT; *, P < 0.05; **, P < 0.01; ***, P < 0.001 for neg-WT vs. IL-37tg; actual P-values: (d) all < 0.001 except Ctrl, 0.65 and TNF, 0.04. (e) Ctrl, 0.58; LPS, 0.001; LPS plus IL-12 and IL-1β, < 0.001; IL-12 plus IL-18, 0.004.
Figure 8
Figure 8
Silencing of Smad3 reduces the activity of IL-37 in vivo. IL-37tg and neg-WT mice inhaled 3 μg/g of either scrambled siRNA (scr) or siRNA to Smad3 (siSm3). 20 h later, each mouse inhaled 3 μg/g LPS. After another 18 h, lungs were harvested and assayed for production of Smad3 (a) and cytokines (b, c). (a) Phospho-Smad3 was assessed by immunoblotting. Four representative pairs of mice are shown. (b, c) Absolute concentrations of each cytokine per mg total protein (t.p.) ± SEM are shown. n = 8 for each group, i.e. for neg-WT + scrambled, neg/WT + siSmad3, IL-37tg + scrambled, and IL-37tg + siSmad3. ns, not significant; *, P < 0.05; **, P < 0.01; ***, P < 0.001 for IL-37tg + scrambled vs neg-WT + scrambled and ◆, P < 0.05; ◆◆, P < 0.01 for IL-37tg + scrambled vs IL-37tg + siSmad3. Numbers indicate fold-increases conferred by treatment with siSmad3, i.e. comparing scrambled to siSmad3 in neg-WT and IL-37tg. P-values are listed in Supplementary Table 3.

References

    1. Schmitz J, et al. IL-33, an interleukin-1-like cytokine that signals via the IL-1 receptor-related protein ST2 and induces T helper type 2-associated cytokines. Immunity. 2005;23:479–490. - PubMed
    1. Dunn E, Sims JE, Nicklin MJ, O'Neill LA. Annotating genes with potential roles in the immune system: six new members of the IL-1 family. Trends Immunol. 2001;22:533–536. - PubMed
    1. Priestle JP, Schar HP, Grutter MG. Crystallographic refinement of interleukin 1 beta at 2.0 A resolution. Proc Natl Acad Sci USA. 1989;86:9667–9671. - PMC - PubMed
    1. Pan G, et al. IL-1H, an interleukin 1-related protein that binds IL-18 receptor/IL-1Rrp. Cytokine. 2001;13:1–7. - PubMed
    1. Bufler P, et al. A complex of the IL-1 homologue IL-1F7b and IL-18-binding protein reduces IL-18 activity. Proc Natl Acad Sci USA. 2002;99:13723–13728. - PMC - PubMed

Publication types