

Soil Respiration in European Grasslands in Relation to Climate and Assimilate Supply
- PMID: 20936099
- PMCID: PMC2950939
- DOI: 10.1007/s10021-008-9198-0
Soil Respiration in European Grasslands in Relation to Climate and Assimilate Supply
Abstract
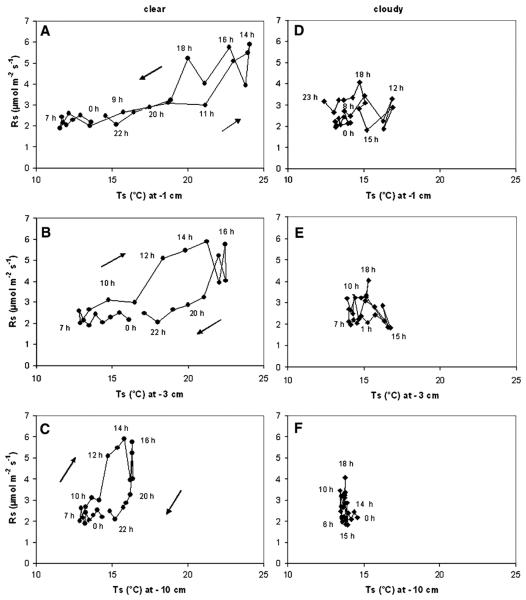
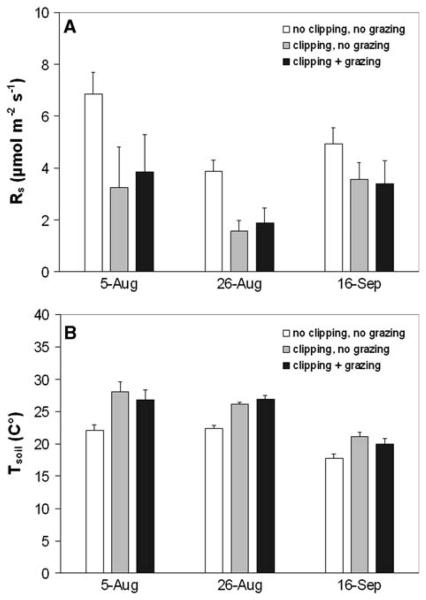
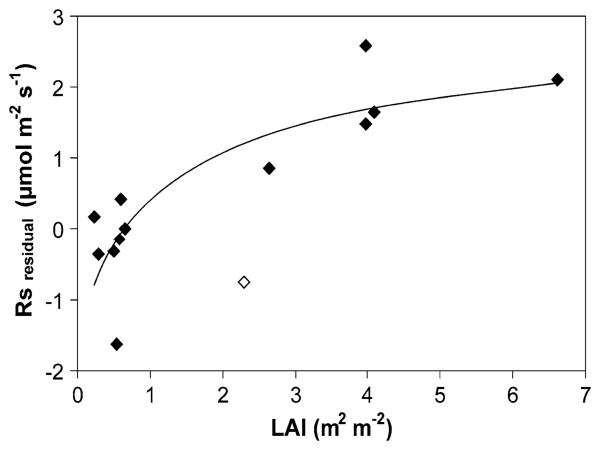
Soil respiration constitutes the second largest flux of carbon (C) between terrestrial ecosystems and the atmosphere. This study provides a synthesis of soil respiration (R(s)) in 20 European grasslands across a climatic transect, including ten meadows, eight pastures and two unmanaged grasslands. Maximum rates of R(s) (R(s(max) )), R(s) at a reference soil temperature (10°C; R(s(10) )) and annual R(s) (estimated for 13 sites) ranged from 1.9 to 15.9 μmol CO(2) m(-2) s(-1), 0.3 to 5.5 μmol CO(2) m(-2) s(-1) and 58 to 1988 g C m(-2) y(-1), respectively. Values obtained for Central European mountain meadows are amongst the highest so far reported for any type of ecosystem. Across all sites R(s(max) ) was closely related to R(s(10) ).Assimilate supply affected R(s) at timescales from daily (but not necessarily diurnal) to annual. Reductions of assimilate supply by removal of aboveground biomass through grazing and cutting resulted in a rapid and a significant decrease of R(s). Temperature-independent seasonal fluctuations of R(s) of an intensively managed pasture were closely related to changes in leaf area index (LAI). Across sites R(s(10) ) increased with mean annual soil temperature (MAT), LAI and gross primary productivity (GPP), indicating that assimilate supply overrides potential acclimation to prevailing temperatures. Also annual R(s) was closely related to LAI and GPP. Because the latter two parameters were coupled to MAT, temperature was a suitable surrogate for deriving estimates of annual R(s) across the grasslands studied. These findings contribute to our understanding of regional patterns of soil C fluxes and highlight the importance of assimilate supply for soil CO(2) emissions at various timescales.
Figures


References
-
- Amthor JS, Baldocchi DD. Terrestrial higher plant respiration and net primary productivity. In: Roy J, Saugier B, Mooney HA, editors. Terrestrial global productivity. Academic Press San Diego; San Diego: 2001. pp. 33–59.
-
- Bahn M, Knapp M, Garajova Z, Pfahringer N, Cernusca A. Root respiration in temperate mountain grasslands differing in land use. Glob Chang Biol. 2006;12:995–1006.
-
- Bahn M, Kutsch W, Heinemeyer A, Janssens I. Towards a standardised protocol for the assessment of soil CO2 fluxes. In: Kutsch W, Bahn M, Heinemeyer A, editors. Soil carbon fluxes. An integrated methodology. Cambridge University Press; 2008. (in press)
-
- Bain WG, Hutyra L, Patterson DC, Bright AV, Daube BC, Munger JW, Wofsy SC. Wind-induced error in the measurement of soil respiration using closed dynamic chambers. Agric For Meteorol. 2005;131:225–32.
Grants and funding
LinkOut - more resources
Full Text Sources
Research Materials