. 2010 Dec;28(12):2129-40.
doi: 10.1002/stem.538.

Characterizing the contribution of stem/progenitor cells to tumorigenesis in the Pten-/-TP53-/- prostate cancer model

Affiliations

Characterizing the contribution of stem/progenitor cells to tumorigenesis in the Pten-/-TP53-/- prostate cancer model

Wassim G Abou-Kheir et al. Stem Cells. 2010 Dec.

Abstract

Loss of PTEN is one of the most common mutations in prostate cancer, and loss of wild-type TP53 is associated with prostate cancer progression and castrate resistance. Modeling prostate cancer in the mouse has shown that while Pten deletion in prostate epithelial cells leads to adenocarcinoma, combined loss of Pten and TP53 results in rapidly developing disease with greater tumor burden and early death. TP53 contributes significantly to the regulation of stem cell self-renewal, and we hypothesized that loss of Pten/TP53 would result in measurable changes in prostate cancer stem/progenitor cell properties. Clonogenic assays that isolate progenitor function in primary prostate epithelial cells were used to measure self-renewal, differentiation, and tumorigenic potential. Pten/TP53 null as compared with wild-type protospheres showed increased self-renewal activity and modified lineage commitment. Orthotopic transplantation of Pten/TP53 null cells derived from protospheres produced invasive Prostatic Intraepithelial Neoplasia (PIN)/adenocarcinoma, recapitulating the pathology seen in primary tumors. Pten/TP53 null progenitors relative to wild type also demonstrated increased dependence on the AKT/mammalian target of rapamycin complex 1 (mTORC1) and androgen receptor (AR) pathways for clonogenic and tumorigenic growth. These data demonstrate roles for Pten/TP53 in prostate epithelial stem/progenitor cell function, and moreover, as seen in patients with castrate-resistant prostate cancer, suggest for the involvement of an AR-dependent axis in the clonogenic expansion of prostate cancer stem cells.


Conflict of interest statement

Disclosure of Potential Conflicts of Interest

The authors indicate no potential conflicts of interest.

Figures
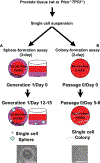
Figure 1.
Figure 1.
The prostate sphere- and colony-forming assays demonstrate the presence of stem/progenitor cells in freshly isolated prostates. (A): A schematic illustration of the sphere formation assay in 3-day basement membrane culture. A single-cell suspension of unfractionated prostate cells was mixed with Matrigel (1:1) and plated at a density of 10,000 cells/well. Media was changed every 2–3 days and bright-field images were taken at days 12–15. A representative bright-field image is shown. Scale bar = 100 µm. (B): A schematic illustration of the colony formation assay in 2D culture. A single-cell suspension of unfractionated prostate cells was plated at a density of 10,000 cells/well. Media was changed every 2–3 days and bright-field images were taken at days 5–7. A representative bright-field image of a prostate epithelial colony is shown. Scale bar = 100 µm.
Figure 2.
Figure 2.
Pten−/−TP53−/− prostate spheres are significantly larger than their wt counterpart. (A): Representative bright-field and H&E images of wt and Pten−/−TP53−/− prostate spheres are shown. Scale bar = 100 µm. (B): Quantification of the average diameter of wt and Pten−/−TP53−/− prostate spheres. The data are reported as mean ± SEM (*, p < .05). (C): Quantification of the average number of cells/wt and Pten−/−TP53−/− prostate spheres. The data are reported as mean ± SEM (*, p < .05). (D): Cytospun cells derived from wt and Pten−/−TP53−/− protospheres were labeled for Ki67 and quantified. At least 300 cells were counted. The data are reported as mean ± SEM (*, p < .05). (E): Immunofluorescent images of wt and Pten−/−TP53−/− protospheres stained for Ki67 are shown. Scale bar 50 µm. (F): Quantification of the average diameter of prostate epithelial cells from dissociated wt and Pten−/−TP53−/− protospheres. The data are reported as mean ± SEM (*, p < .05). Abbreviation: wt, Ptenfl/fl;TP53fl/f;lLuc+.
Figure 3.
Figure 3.
Pten−/−TP53−/− primary prostate epithelial cells demonstrate higher self-renewal activity. (A): wt and Pten/TP53 null primary prostate epithelial cells were plated in Matrigel at a density of 10,000 cells/well for sphere formation assay. Spheres generated from primary cells are referred to as G1 spheres. Sphere-forming units obtained from serially passaged protospheres are shown. A representative analysis of four independent experiments is shown. The data are reported as mean ± SD (*, p < .05). (B): wt and Pten/p53 null primary prostate epithelial cells were seeded at a density of 10,000 cells/well for colony formation assay. The initial colonies formed from primary cells are referred to as P0. The subsequent colonies were generated by cells dissociated from spheres. A representative analysis of four independent experiments is shown. The data are reported as mean ± SD (*, p < .05). (C): wt and Pten/TP53 null primary prostate epithelial cells were plated in Matrigel at a density of 10,000 cells, and the accumulated expansion of the spheres was enumerated for six generations. (D): Starting from the same population as in (C), the number of cells from each generation of spheres was determined by counting an aliquot of dissociated spheres. The experiment was repeated twice, and a representative experiment is shown. Abbreviations: G1, Generation 1; wt, Ptenfl/fl;TP53fl/f;lLuc+.
Figure 4.
Figure 4.
Immunophenotype of wt and Pten/TP53 null protospheres and prostate epithelial colonies. (A): Immunofluorescent images of confocal cross sections from wt and Pten−/−TP53−/− protospheres stained for PTEN (upper panel), p-AKT (middle panel), and P63 (lower panel). Scale bar = 100 µm. (B): Immunofluorescent images of confocal cross section wt and Pten−/−TP53−/− protospheres stained for CK5 and CK8 (top panel), CK5 (middle panel), and β3 tubulin (lower panel). Scale bar = 50 µm. (C): Immunohistochemical images of serial sections from wt and Pten−/−TP53−/− protospheres stained for CK5 (upper panel) and CK8 (lower panel). Scale bar = 50 µm. (D): Immunofluorescent images of wt and Pten−/−TP53−/− prostate epithelial colonies stained for PTEN (upper panel) and p-AKT (lower panel). Scale bar = 100 µm. (E): Immunofluorescent images of wt and Pten−/−TP53−/− prostate epithelial colonies stained for CK5 and CK8 (upper panel) and β3 tubulin (lower panel). Scale bar = 100 µm. Abbreviations: DAPI, 4′,6-diamidino-2-phenylindole; p-AKT, phosphorylated AKT; PTEN, phosphatase and tensin homolog; wt, Ptenfl/fl;TP53fl/f;lLuc+.
Figure 5.
Figure 5.
Pten and TP53 deletion alters the lineage hierarchical distribution of prostate epithelial cells in protospheres. (A): Immunofluorescent images of cytospin preparations of wt and Pten−/−TP53−/− primary prostate cells stained for CK5 (upper panel) or CK5 and CK8 from Pten−/−TP53−/− only (lower panel). The arrows indicate the different levels of CK5 expression. (B): Quantification of the percentage of CK5+, CK8+, and CK5+/CK8+ cells from cytospin preparations of prostate cells isolated from primary prostate tissues, protospheres, and prostate epithelial colonies. The average of three independent experiments is shown. The data are reported as mean ± SEM (*, p < .05). (C): Quantification of the percentage of β3 tubulin+ cells from cytospin preparations of prostate cells isolated from primary prostate tissues, protospheres, and prostate epithelial colonies. The average of three independent experiments is shown. The data are reported as mean ± SEM (*, p < .05). Abbreviations: DAPI, 4′,6-diamidino-2-phenylindole; wt, Ptenfl/fl;TP53fl/f;lLuc+.
Figure 6.
Figure 6.
Characterization of orthotopic tumors initiated from G1 sphere-derived cells. (A): Orthotopic prostate carcinoma histological patterns as a percent of total tumor area for each individual orthotopic tumor that was generated by injecting nude mice with cells from dissociated G1 protospheres (PIN/Adeno: orthotopic PIN and adenocarcinoma; Basal/Squam: basal squamous carcinoma). (B): Cross sections of orthotopic tumors stained with H&E showing typical PIN/adenocarcinoma and basal squamous carcinoma. The arrows indicate wild-type nude mouse prostate glands entrapped in the tumor area. Scale bar = 50 µm. (C): Serial sections of the adeno and basal/squam orthotopic tumors labeled with antibodies for CK8, CK5, Synaptophysin, and AR. Scale bar = 50 µm. Abbreviations: AR, androgen receptor; PIN, prostatic intraepithelial neoplasia.
Figure 7.
Figure 7.
AKT/mTORC1 and androgen receptor (AR) pathways play central roles in regulating the clonogenic and tumorigenic activity of Pten−/−TP53−/− stem/progenitor prostate epithelial cells. The activity of wt and Pten/TP53 null primary prostate epithelial stem/progenitor cells was tested in a colony formation assay (A) and sphere formation assay (B) in the absence or presence of drugs targeting the AKT/mTORC1 pathway (Rapamycin and Triciribine) and AR pathway (nilutamide and bicalutamide). A representative analysis of four independent experiments is shown. The data are reported as mean ± SEM (*, p < .05). (D): Pten/TP53 null primary prostate cells (1.5 × 10⁶ per mouse) were injected subcutaneously into NOD-SCID male mice. After a palpable tumor was detected (week 0), mice were implanted with a 100 mg flutamide pellet or treated i.p. four times a week with 20 mg/kg CCI-779 or with vehicle only. Tumor volume was measured every week and the average volume of four mice per group is plotted. The data are reported as mean ± SEM (*, p < .05). Abbreviations: DHT, dihydrotestosterone; wt, Ptenfl/fl;TP53fl/f;lLuc+; mTORC, mammalian target of rapamycin; NOD-SCID, non-obese diabetic-severe combined immunodeficiency.

References

    1. Roudier MP, True LD, Higano CS et al. Phenotypic heterogeneity of end-stage prostate carcinoma metastatic to bone. Hum Pathol 2003;34: 646–653. - PubMed
    1. Lapointe J, Li C, Giacomini CP et al. Genomic profiling reveals alternative genetic pathways of prostate tumorigenesis. Cancer Res 2007; 67:8504–8510. - PubMed
    1. Sircar K, Yoshimoto M, Monzon FA et al. PTEN genomic deletion is associated with p-Akt and AR signalling in poorer outcome, hormone refractory prostate cancer. J Pathol 2009;218:505–513. - PubMed
    1. Taylor BS, Schultz N, Hieronymus H et al. Integrative genomic profiling of human prostate cancer. Cancer Cell 2010;18:11–22. - PMC - PubMed
    1. Agell L, Hernandez S, de Muga S et al. KLF6 and TP53 mutations are a rare event in prostate cancer: Distinguishing between Taq polymerase artifacts and true mutations. Mod Pathol 2008;21:1470–1478. - PubMed

Publication types

MeSH terms