Review
. 2011:73:283-309.
doi: 10.1146/annurev-physiol-012110-142150.

Tight junction pore and leak pathways: a dynamic duo

Affiliations
Review

Tight junction pore and leak pathways: a dynamic duo

Le Shen et al. Annu Rev Physiol. 2011.

Abstract

Tissue barriers that restrict passage of liquids, ions, and larger solutes are essential for the development of multicellular organisms. In simple organisms this allows distinct cell types to interface with the external environment. In more complex species, the diversity of cell types capable of forming barriers increases dramatically. Although the plasma membranes of these barrier-forming cells prevent flux of most hydrophilic solutes, the paracellular, or shunt, pathway between cells must also be sealed. This function is accomplished in vertebrates by the zonula occludens, or tight junction. The tight junction barrier is not absolute but is selectively permeable and is able to discriminate between solutes on the basis of size and charge. Many tight junction components have been identified over the past 20 years, and recent progress has provided new insights into the proteins and interactions that regulate structure and function. This review presents these data in a historical context and proposes an integrated model in which dynamic regulation of tight junction protein interactions determines barrier function.


Figures

Figure 1
Figure 1
The apical junctional complex. (a) Transmission electron micrograph showing junctional complexes between two villous enterocytes. The tight junction (TJ) is just below the microvilli (Mv), followed by the adherens junction (AJ). The desmosomes (D) are located basolaterally. Panel a courtesy of Dr. Amanda Marchiando, The University of Chicago. (b) Freeze-fracture electron micrograph showing apical microvilli (Mv) and tight junction strands (TJ) in a cultured intestinal epithelial cell. Panel b courtesy of Dr. Eveline Schneeberger, Harvard Medical School. (c) Schematic showing interactions between F-actin, myosin II, zonula occludens-1 (ZO-1), claudins, tight junction–associated marvel proteins (TAMPs), and immunoglobulin superfamily members such as junctional adhesion molecules (JAM) and the coxsackie adenovirus receptor (CAR). Panel b reprinted from Reference with permission.
Figure 2
Figure 2
The tight junction is composed of at least two functionally distinct pathways: a high-capacity, charge-selective pore pathway that allows passage of small ions and uncharged molecules and a low-capacity leak pathway that allows flux of larger ions and molecules, regardless of charge. The permeability of these pathways can be measured using several complementary methods. However, these measure population averages; no tools are presently available to measure local tight junction permeability on a submicrometer scale. (a) Transepithelial electrical resistance (TER) measures the flux of all ions across the epithelium. This is typically done by applying a transepithelial current, by measuring the generated potential, and by using Ohm's law to calculate the resistance to current flow. The most common ions in physiological solutions, Na+ and Cl, carry this current. These small ions do not discriminate between pore and leak pathways, and therefore TER cannot be used to measure tight junction size or charge selectivity. Increased permeability of either pathway reduces TER. Like all electrophysiological measures of tight junction function, TER reflects tight junction permeability best when ion conductance across the junction is far greater than across apical and basolateral membranes, such as in leaky epithelia. (b) Charge selectivity can be measured by the dilution potential technique. By inducing a transepithelial electrochemical gradient, e.g., by altering, iso-osmotically, apical or basolateral NaCl concentrations, one can establish a new equilibrium potential based on the relative paracellular permeabilities of Na+ and Cl. For example, a permeability ratio close to 1.0 indicates no charge selectivity and does not alter the equilibrium potential across the monolayer. (Due to the higher mobility in free solution of Cl relative to Na+, the dilution potential of a non-charge-selective pathway will be slightly negative. In practice, this makes a minimal contribution to measurements made across intact, charge-selective tight junctions.) (c) The bi-ionic substitution approach replaces Na+ on one side of the monolayer with organic cations of various sizes. The permeability of each organic cation can be determined and used to assess size selectivity of the pore pathway. (d ) Leak pathway permeability can be assessed by directly measuring macromolecular flux of tracers across the epithelium. Commonly used tracers include mannitol, sucrose, inulin, or polymers, such as polyethylene glycols or dextrans, of varying sizes. Because of their size, most of these molecules reflect the leak, but not the pore, pathway. However, some polyethylene glycols are small enough to allow analysis of pore pathway permeability.
Figure 3
Figure 3
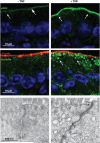
Tight junction regulation by tumor necrosis factor (TNF). Jejunal mucosa from control (left column) and TNF-treated (right column) mice were stained for phosphorylated MLC (pMLC; top row) or occludin and F-actin (middle row). Nuclei (blue) are shown for orientation. Arrows show enrichment of phosphorylated MLC at junctions (top row) and occludin-laden endocytic vesicles (middle row). Transmission electron microscopy (bottom row) shows perijunctional actomyosin condensation and endocytic vesicle accumulation (black arrows) after TNF treatment. Panels from Reference with permission.
Figure 4
Figure 4
Analysis of protein interactions in living cells is greatly facilitated using fluorescent fusion proteins. Methods of measurement include fluorescence recovery after photobleaching (FRAP), fluorescence loss in photobleaching (FLIP), and time-lapse imaging of photoactivatable and photoswitchable fluoroproteins. (a) FRAP analysis of tight junction proteins is accomplished by photobleaching a defined segment of the junction followed by time-lapse imaging until a later time at which steady state is achieved (tss). Quantitative analysis of fluorescence recovery can be used to determine the size of the pool available for exchange, or mobile fraction, as well as the rate of exchange, as reflected by the time required for half-maximal recovery. (b) FLIP can be used to assess exchange between morphologically distinct protein pools. In the example shown, continuous photobleaching of the cytoplasm, sparing the tight junction, leads to reduced fluorescence at the tight junction. This indicates exchange between tight junction and cytoplasmic pools. Similarly, analysis of fluorescence in one area of the tight junction during continuous photobleaching of a separate area of the tight junction can be used to measure exchange between these areas. (c) Photoactivatable and photoswitchable fluoroproteins allow experiments that are essentially the reverse of FRAP. For example, targeted activation at one region of the tight junction allows measurement of the rate at which fluorescence moves away from the junction and simultaneous morphological and quantitative analysis of the sites to which the protein is trafficked.
Figure 5
Figure 5
Models of tight junction protein behavior. (a) Computer simulations of tight junction FLIP (fluorescence loss in photobleaching) and FRAP (fluorescence recovery after photobleaching) behavior support the presence of different dynamic behaviors for claudin-1 (Cldn1), occludin (Ocln), and zonula occludens-1 (ZO-1). Cldn1 is localized at the tight junction, and fluorescence recovery occurs via diffusion of the mobile pool from adjacent unbleached areas of tight junction. The fixed pool does not exchange. Like Cldn1, Ocln diffuses within the tight junction, but exchange also occurs with a lateral membrane pool. However, unlike Cldn1, there is no fixed Ocln pool. Both fixed and exchangeable ZO-1 pools are present at the tight junction; the latter exchanges with a cytosolic ZO-1 pool. (b) The rate of ZO-1 exchange between the tight junction and cytosol is regulated through interactions with actin. ZO-1 dynamics are best modeled as containing two exchangeable pools at the tight junction. An actin-binding region (ABR)-anchored pool exchanges slowly between the cytosol and the tight junction and is sensitive to myosin light-chain kinase (MLCK) inhibition, whereas a MLCK-independent pool exchanges rapidly between the tight junction and the cytoplasm.

References

    1. Farquhar M, Palade G. Junctional complexes in various epithelia. J. Cell Biol. 1963;17:375–412. - PMC - PubMed
    1. Goodenough DA, Revel JP. A fine structural analysis of intercellular junctions in the mouse liver. J. Cell Biol. 1970;45:272–90. - PMC - PubMed
    1. Machen TE, Erlij D, Wooding FB. Permeable junctional complexes. The movement of lanthanum across rabbit gallbladder and intestine. J. Cell Biol. 1972;54:302–12. - PMC - PubMed
    1. Diamond JM, Bossert WH. Standing-gradient osmotic flow. A mechanism for coupling of water and solute transport in epithelia. J. Gen. Physiol. 1967;50:2061–83. - PMC - PubMed
    1. Foskett JK, Machen TE. Vibrating probe analysis of teleost opercular epithelium: correlation between active transport and leak pathways of individual chloride cells. J. Membr. Biol. 1985;85:25–35. - PubMed

Publication types

Substances

LinkOut - more resources