. 2010 Nov;136(5):541-54.
doi: 10.1085/jgp.201010438. Epub 2010 Oct 11.

Molecular mechanism of allosteric modification of voltage-dependent sodium channels by local anesthetics

Affiliations

Molecular mechanism of allosteric modification of voltage-dependent sodium channels by local anesthetics

Manoel Arcisio-Miranda et al. J Gen Physiol. 2010 Nov.

Abstract

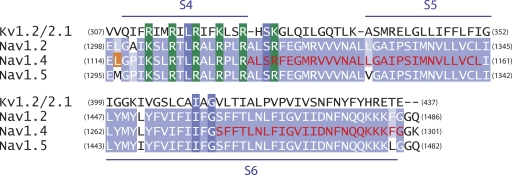
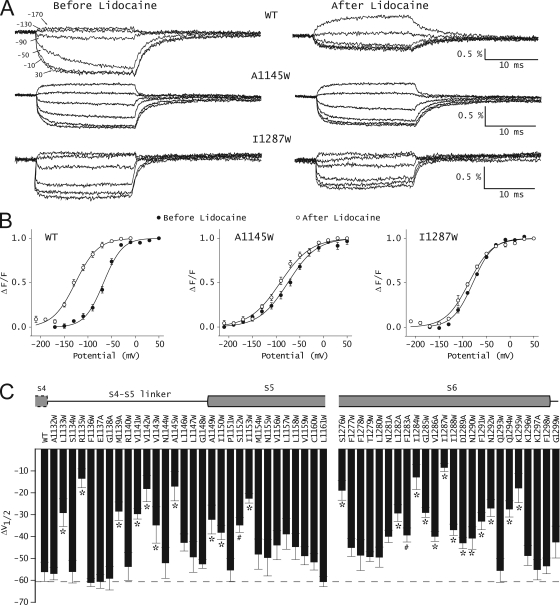
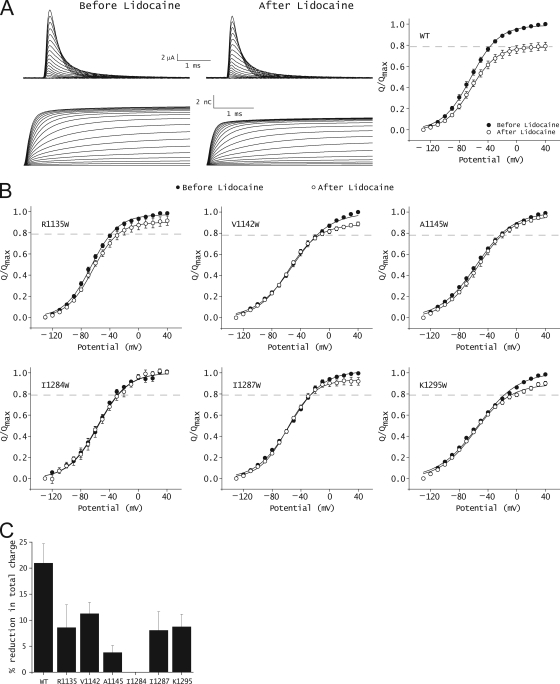
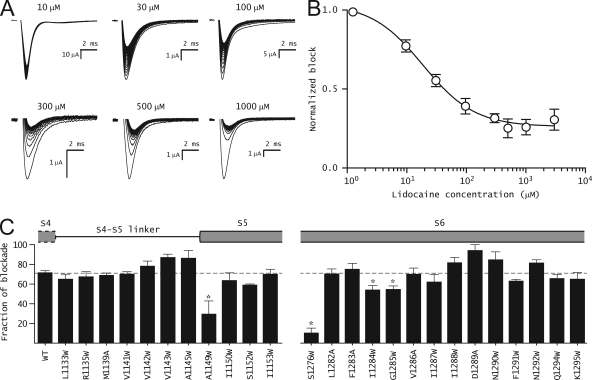
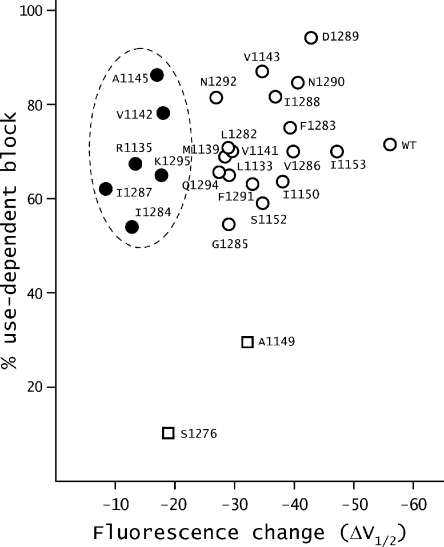
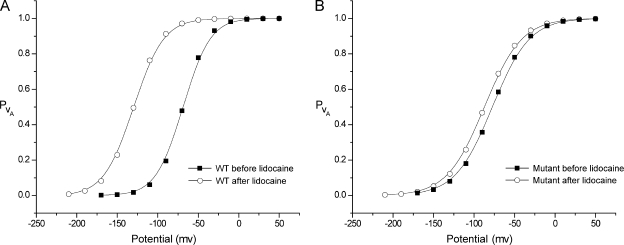
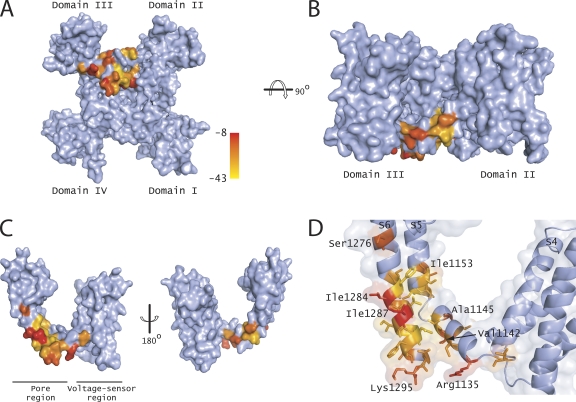
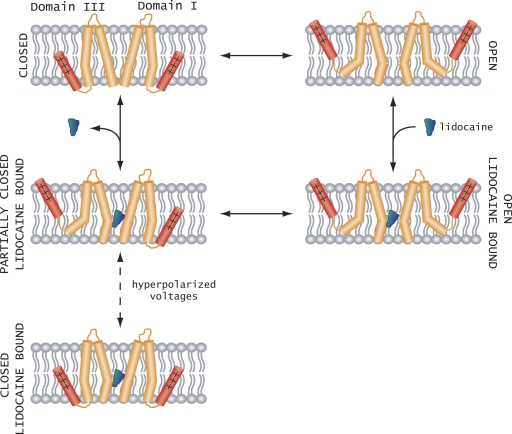
The hallmark of many intracellular pore blockers such as tetra-alkylammonium compounds and local anesthetics is their ability to allosterically modify the movement of the voltage sensors in voltage-dependent ion channels. For instance, the voltage sensor of domain III is specifically stabilized in the activated state when sodium currents are blocked by local anesthetics. The molecular mechanism underlying this long-range interaction between the blocker-binding site in the pore and voltage sensors remains poorly understood. Here, using scanning mutagenesis in combination with voltage clamp fluorimetry, we systematically evaluate the role of the internal gating interface of domain III of the sodium channel. We find that several mutations in the S4-S5 linker and S5 and S6 helices dramatically reduce the stabilizing effect of lidocaine on the activation of domain III voltage sensor without significantly altering use-dependent block at saturating drug concentrations. In the wild-type skeletal muscle sodium channel, local anesthetic block is accompanied by a 21% reduction in the total gating charge. In contrast, point mutations in this critical intracellular region reduce this charge modification by local anesthetics. Our analysis of a simple model suggests that these mutations in the gating interface are likely to disrupt the various coupling interactions between the voltage sensor and the pore of the sodium channel. These findings provide a molecular framework for understanding the mechanisms underlying allosteric interactions between a drug-binding site and voltage sensors.


Figures

Figure 1.
Figure 1.
Sequence alignment of the putative transmembrane segments of domain III of the brain, nerve, and the muscle sodium channels (Nav1.2, Nav1.4, and Nav1.5) with a chimeric potassium channel (Kv1.2/2.1). The conserved positive charges of the S4 transmembrane segment are highlighted in green. The mutated regions in the S4–S5 linker, N terminus of S5, and C terminus of S6 are shown in red. The fluorophore was attached to an introduced cysteine at the L1115C (in orange) position.
Figure 2.
Figure 2.
Effect of lidocaine on the energetics of the domain III voltage sensor. (A) Time course of voltage-dependent fluorescence signals from domain III of WT and a couple of representative mutant sodium channels. Fluorescence traces were obtained before and after 10-mM lidocaine application by pulsing to a test potential (ranging from +50 to −210 mV) for 20 ms, with a prepulse to −120 mV for 20 ms. Each trace represents an average of 10 trials with an interval of 1 s between each pulse. The scale bars are provided as insets, and the percentage fluorescence changes (ΔF/F) are on the y axis. (B) Steady-state F-V curves before (filled symbols) and after (open symbols) 10-mM lidocaine application. The lines represent the best fits of the averaged data to a single Boltzmann function. The error bars represent the average ± SEM for each data point. (C) Summary of shifts in F-V curves of WT and various mutants upon the application of lidocaine. ΔV1/2 was obtained as: ΔV1/2 = V1/2(after lidocaine) − V1/2(before lidocaine). Each bar represents mean ± SEM of at least three independent oocyte measurements. The gray dashed line represents the shift in F-V curves of WT. To test whether these differences were statistically significant, a one-way ANOVA test was used, followed by a post-hoc Dunnett’s test. *, P < 0.001; #, P < 0.05.
Figure 3.
Figure 3.
Effect of lidocaine on gating currents of WT and mutant sodium channels. (A; left) Representative ON gating currents of the WT channels and their integrals before and after 10-mM lidocaine application. (Right) Steady-state Q-V relationships of the WT channel before (filled symbols) and after (open symbols) lidocaine application. The gray dashed line represents the average reduction in the total gating charge after lidocaine application. The data represent mean ± SEM of at least three independent measurements. The line represents the best fit of the averaged data to a single Boltzmann function. (B) Steady-state Q-V relationships of mutant channels before (filled symbols) and after (open symbols) 10-mM lidocaine application. The gray dashed line represents the average reduction in the total gating charge after the application of lidocaine to the WT channel. The data represent mean ± SEM of at least three independent measurements, and the smooth lines represent the best fits of the averaged data to a single Boltzmann function. (C) Percentage reduction in the total gating charge upon the application of lidocaine in the WT and mutant channels. The total charge movement was measured by a pulse to +40 mV from −130 mV. The data represent mean ± SEM of at least three independent measurements.
Figure 4.
Figure 4.
Use-dependent block of WT and mutant channels by lidocaine. (A) Representative ionic current traces of WT channel in the presence of different concentrations of lidocaine. Each trace was obtained by applying 100 pulses from −80 to −20 mV for 20 ms at 10 Hz from a holding potential of −80 mV. (B) Dose–response curve for use-dependent block of WT channel by lidocaine. The symbols represent mean ± SEM of at least three independent measurements, and the smooth line represents the best fit of the averaged data to the Hill equation. (C) Percent block of WT and mutant channels after 100 pulses in presence of 1 mM lidocaine. Gray dashed line represents the mean percent block of the WT channel (71.5 ± 2.2%; n = 5). The current protocol is the same as in A. In both B and C, the data represent mean ± SEM of at least three independent measurements.
Figure 5.
Figure 5.
Relationship between the ΔV1/2 of F-V curves and maximal use-dependent block by lidocaine. ΔV1/2 of F-V curves upon lidocaine addition and the maximal use-dependent block of ionic currents by lidocaine were obtained as described in the Results. The mutants whose ΔV1/2 shifts linearly correlate with use-dependent block are represented as open squares. The mutants that show the most reduction in ΔV1/2 without much change in use-dependent block are represented by filled circles, and the remaining mutants that show intermediate levels of reduction in the ΔV1/2 are represented by open symbols.
Figure 6.
Figure 6.
Simulations of fluorescence activation curves of WT and a mutant before and after the addition of lidocaine. The equations describing the probability of activation of the voltage sensor were fitted to the WT data (A) and A1145W (B) to generate the activation curves shown above (refer to Materials and methods). Symbols represent the simulated data points, and the trend lines are fits of the simulated data with a single Boltzmann function.
Figure 7.
Figure 7.
Mapping the mutations that perturb allosteric modification by lidocaine. (A) Surface representation of the Nav1.4 sodium channel model with mutations that disrupt the communication between the lidocaine-binding site and voltage sensor, viewed from the intracellular side. A color gradient from yellow to red was used to represent ΔV1/2 changes induced upon the addition of lidocaine. (B) Same as in A after the structure was rotated by 90°. The domains I and IV are hidden from view by the other two domains. (C) Surface representation of domain III of the Nav1.4 channel. The other three domains were removed for clarity. The residues were color-coded as in A. (D) A close-up view of the S4–S5 linker, N terminus of S5, and C terminus of S6, with transparent surfaces and side chains colored as in A. All of these structures were drawn using PyMol (DeLano Scientific LLC).
Figure 8.
Figure 8.
Plausible model for voltage sensor modification by local anesthetics. Upon depolarization, the voltage sensors move outward and the pore of the sodium channel opens. For clarity, only domains I and III are shown. Lidocaine binds to the open pore with high affinity (open lidocaine bound). When the membrane is repolarized, the domain III pore helices are unable to close because of lidocaine occupying the binding site and destabilizing the resting state of the domain III voltage sensor relative to the open state. Strong hyperpolarization drives the domain III voltage sensor to a resting-like conformation, even though the lidocaine-binding site is occupied.

References

    1. Armstrong C.M. 1971. Interaction of tetraethylammonium ion derivatives with the potassium channels of giant axons. J. Gen. Physiol. 58:413–437 10.1085/jgp.58.4.413 - DOI - PMC - PubMed
    1. Bean B.P., Cohen C.J., Tsien R.W. 1983. Lidocaine block of cardiac sodium channels. J. Gen. Physiol. 81:613–642 10.1085/jgp.81.5.613 - DOI - PMC - PubMed
    1. Bezanilla F., Perozo E., Papazian D.M., Stefani E. 1991. Molecular basis of gating charge immobilization in Shaker potassium channels. Science. 254:679–683 10.1126/science.1948047 - DOI - PubMed
    1. Cahalan M.D. 1978. Local anesthetic block of sodium channels in normal and pronase-treated squid giant axons. Biophys. J. 23:285–311 10.1016/S0006-3495(78)85449-6 - DOI - PMC - PubMed
    1. Cahalan M.D., Almers W. 1979. Interactions between quaternary lidocaine, the sodium channel gates, and tetrodotoxin. Biophys. J. 27:39–55 10.1016/S0006-3495(79)85201-7 - DOI - PMC - PubMed

Publication types