Comparative Study
. 2010 Dec;3(6):624-31.
doi: 10.1161/CIRCEP.110.945295. Epub 2010 Oct 11.

Determinants of postinfarction ventricular tachycardia

Affiliations
Comparative Study

Determinants of postinfarction ventricular tachycardia

Thomas Crawford et al. Circ Arrhythm Electrophysiol. 2010 Dec.

Abstract

Background: Structural factors contributing to the development of postinfarction ventricular tachycardia (VT) are unclear. The purpose of this study was to analyze infarct architecture and electrogram characteristics in patients with and without inducible VT and to identify correlates of postinfarction VT.

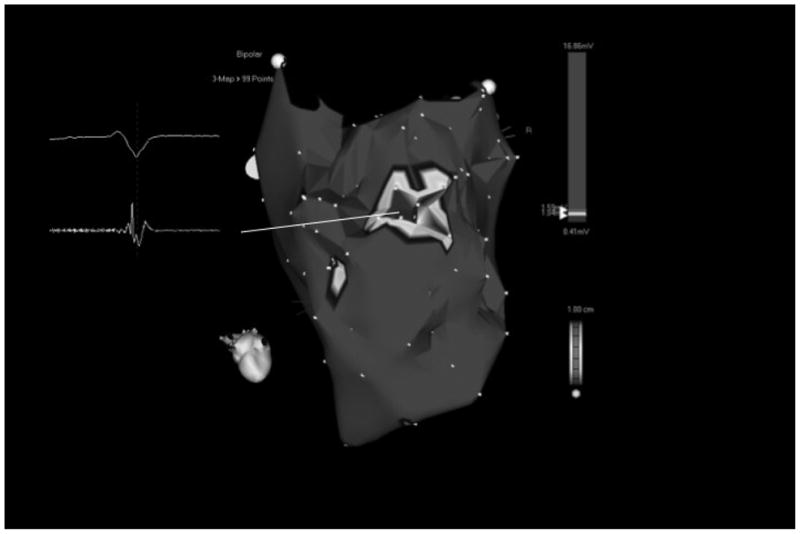
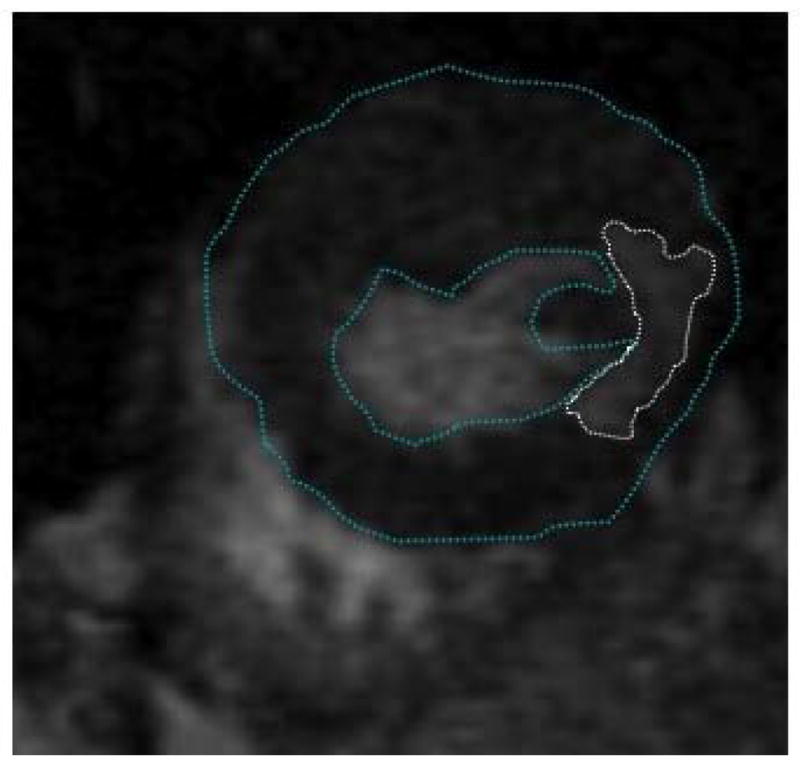
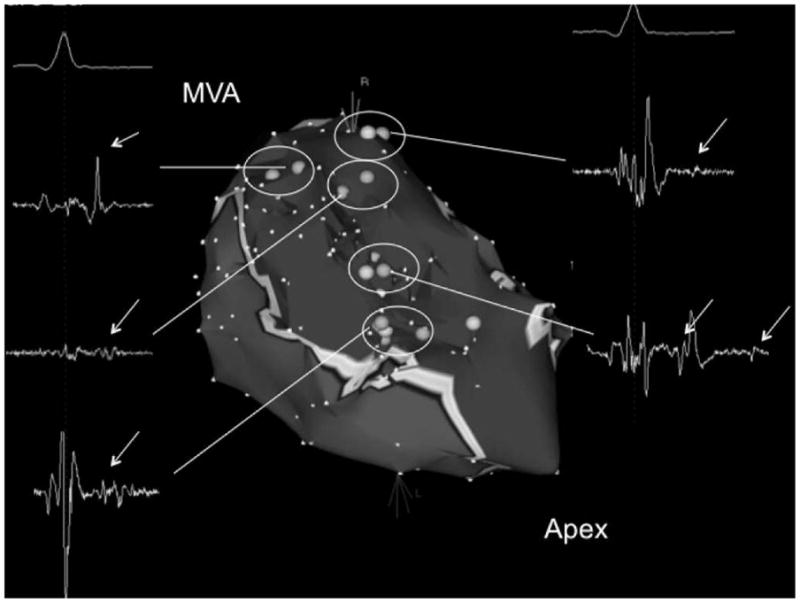
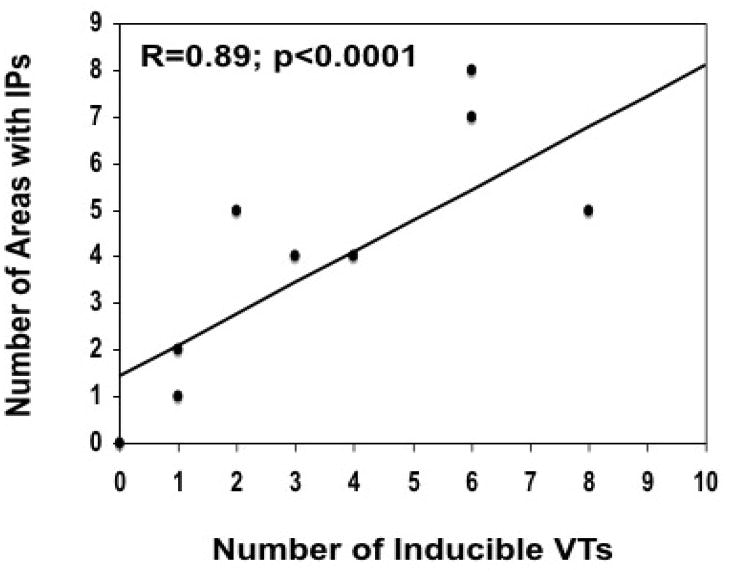
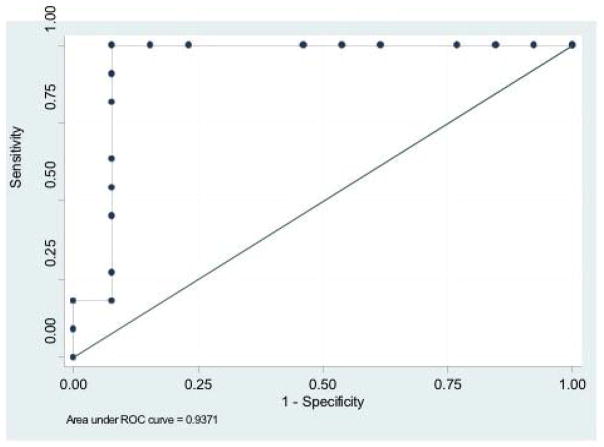
Methods and results: Twenty-four postinfarction patients (median age, 64 [53, 70] years) were referred for radiofrequency catheter ablation of VT (n = 12) or frequent symptomatic premature ventricular contractions (PVCs) (n = 12). Delayed-enhanced (DE) MRI was obtained before ablation. Electroanatomical mapping was performed and scar area and electrogram characteristics of the scar tissue compared in patients with and without inducible VT. The median ejection fraction in patients with and without inducible VT was 27% (22%, 43%) and 43% (40%, 47%), respectively (P = 0.085). Subendocardial infarct area determined by DE-MRI was larger in patients with inducible VT (43 [38, 62] cm(2)) than in those with noninducible VT (8 [4, 11] cm(2); P = 0.002), and unipolar and bipolar voltages on electroanatomical maps were significantly lower in patients with inducible VT (both P<0.05). An infarct volume of >14% identified 11 of 12 patients with inducible VT (area under the curve, 0.94; P = 0.007). On electroanatomical mapping, distinct sites with isolated potentials (IPs) were more prevalent in patients with inducible VT than in those without (13.2% versus 1.1% of points within scar; P < 0.001). The number of inducible VTs correlated with the number of distinct sites with IPs (R = 0.87; P<0.0001).

Conclusions: Scar tissue in postinfarction patients with inducible VT shows quantitative and qualitative differences from scars in patients without inducible VT. Scar size and IPs are correlated with VT inducibility.


Conflict of interest statement

Conflict of Interest Disclosures: Dr Bogun participated in a catheter study by Biosense Webster. None of the remaining authors have any relationships to disclose.

Figures

Figure 1
Figure 1
Figure 1 a - Voltage map of the posterior left ventricle in a patient with prior inferior wall infarction without inducible VT. There is a localized area of low voltage that corresponds to the area of delayed enhancement in Figure 1b. The endocardial low voltage area was 4.8 cm2 as measured by electroanatomical mapping. This patient did not display any isolated potentials during sinus rhythm. The insert shows a non-fractionated abnormal electrogram within the scar tissue. Mitral valve annulus (MVA) and left ventricular apex (apex) are indicated. Figure 1b - Short-axis delayed enhanced magnetic resonance image of the mid left ventricle in the same patient shown in Figure 1a. There is delayed enhancement in the posteroseptal left ventricle (encircled with dotted line). The endocardial and epicardial borders were manually traced (blue colored lines). Infarct volume was 7.6 cm3 and the infarct percentage was 9%.
Figure 1
Figure 1
Figure 1 a - Voltage map of the posterior left ventricle in a patient with prior inferior wall infarction without inducible VT. There is a localized area of low voltage that corresponds to the area of delayed enhancement in Figure 1b. The endocardial low voltage area was 4.8 cm2 as measured by electroanatomical mapping. This patient did not display any isolated potentials during sinus rhythm. The insert shows a non-fractionated abnormal electrogram within the scar tissue. Mitral valve annulus (MVA) and left ventricular apex (apex) are indicated. Figure 1b - Short-axis delayed enhanced magnetic resonance image of the mid left ventricle in the same patient shown in Figure 1a. There is delayed enhancement in the posteroseptal left ventricle (encircled with dotted line). The endocardial and epicardial borders were manually traced (blue colored lines). Infarct volume was 7.6 cm3 and the infarct percentage was 9%.
Figure 2
Figure 2
Figure 2a - Voltage map of the posteroseptal aspect of the left ventricle in a patient with extensive inferoseptal wall infarction in whom 8 different VTs were induced. Areas in red indicate subendocardial scar (voltage <1.0mV). Scar area as assessed by electroanatomic mapping was 57 cm2. Light blue tags indicate sites of isolated potentials. The inserts display the local electrograms at these sites. Isolated potentials are indicated with white arrows. There were 5 distinct sites where isolated potentials were identified (circles). Different critical VT isthmuses were identified at 3/5 sites displaying an isolated potential. The pink tags indicate isthmus sites that were identified during the ablation procedure. The mitral valve annulus (MVA) and left ventricular apex (apex) are indicated. Figure 2b - Left panel: Short-axis delayed enhanced magnetic resonance image of the left ventricle in the same patient shown in Figure 2a. There is delayed enhancement in the inferoseptal left ventricular wall (encircled with a dotted line). Epicardial and endocardial borders are traced with a blue line. Right panel: Long-axis view of the delayed enhanced magnetic resonance image in the same patient. This shows that the scar extends from the mitral valve annulus to the left ventricular apex. The infarct volume was 27.2 cm3 and the infarct percentage was 27%.
Figure 2
Figure 2
Figure 2a - Voltage map of the posteroseptal aspect of the left ventricle in a patient with extensive inferoseptal wall infarction in whom 8 different VTs were induced. Areas in red indicate subendocardial scar (voltage <1.0mV). Scar area as assessed by electroanatomic mapping was 57 cm2. Light blue tags indicate sites of isolated potentials. The inserts display the local electrograms at these sites. Isolated potentials are indicated with white arrows. There were 5 distinct sites where isolated potentials were identified (circles). Different critical VT isthmuses were identified at 3/5 sites displaying an isolated potential. The pink tags indicate isthmus sites that were identified during the ablation procedure. The mitral valve annulus (MVA) and left ventricular apex (apex) are indicated. Figure 2b - Left panel: Short-axis delayed enhanced magnetic resonance image of the left ventricle in the same patient shown in Figure 2a. There is delayed enhancement in the inferoseptal left ventricular wall (encircled with a dotted line). Epicardial and endocardial borders are traced with a blue line. Right panel: Long-axis view of the delayed enhanced magnetic resonance image in the same patient. This shows that the scar extends from the mitral valve annulus to the left ventricular apex. The infarct volume was 27.2 cm3 and the infarct percentage was 27%.
Figure 3
Figure 3
Correlation between number of inducible VTs and the number of distinct sites displaying an isolated potential (IP).
Figure 4
Figure 4
Receiver operator characteristics curve indicating sensitivity and specificity for VT inducibility based on the percentage of scar by DE-MRI.

References

    1. Kaplinsky E, Horowitz A, Neufeld HN. Ventricular reentry and automaticity in myocardial infarction. Effect of size of injury. Chest. 1978;74:66–71. - PubMed
    1. Roberts R, Husain A, Ambos HD, Oliver GC, Cox JR, Jr, Sobel BE. Relation between infarct size and ventricular arrhythmia. Br Heart J. 1975;37:1169–75. - PMC - PubMed
    1. Califf RM, Burks JM, Behar VS, Margolis JR, Wagner GS. Relationships among ventricular arrhythmias, coronary artery disease, and angiographic and electrocardiographic indicators of myocardial fibrosis. Circulation. 1978;57:725–32. - PubMed
    1. Bolick DR, Hackel DB, Reimer KA, Ideker RE. Quantitative analysis of myocardial infarct structure in patients with ventricular tachycardia. Circulation. 1986;74:1266–79. - PubMed
    1. Simonetti OP, Kim RJ, Fieno DS, Hillenbrand HB, Wu E, Bundy JM, Finn JP, Judd RM. An improved MR imaging technique for the visualization of myocardial infarction. Radiology. 2001;218:215–23. - PubMed

Publication types

MeSH terms