. 2010 Dec 17;285(51):39790-800.
doi: 10.1074/jbc.M110.151373. Epub 2010 Oct 6.

Gating of a G protein-sensitive mammalian Kir3.1 prokaryotic Kir channel chimera in planar lipid bilayers

Affiliations

Gating of a G protein-sensitive mammalian Kir3.1 prokaryotic Kir channel chimera in planar lipid bilayers

Edgar Leal-Pinto et al. J Biol Chem. .

Abstract

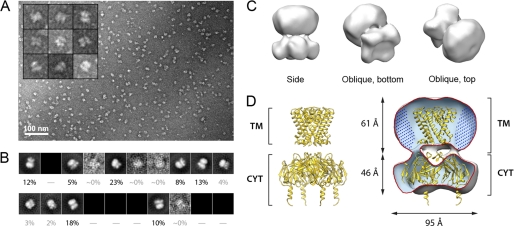
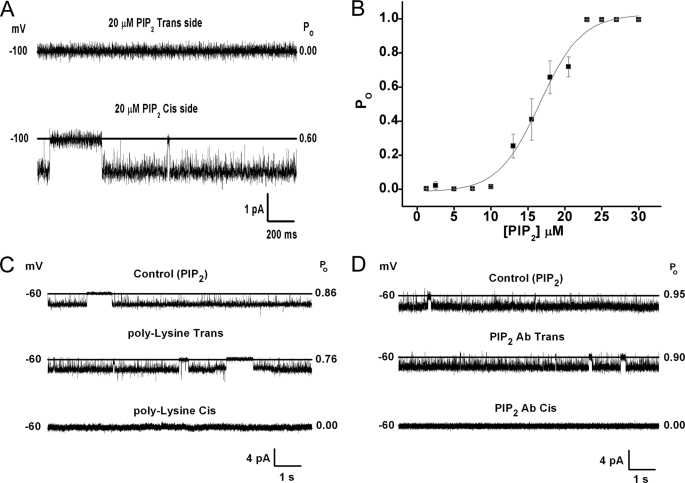
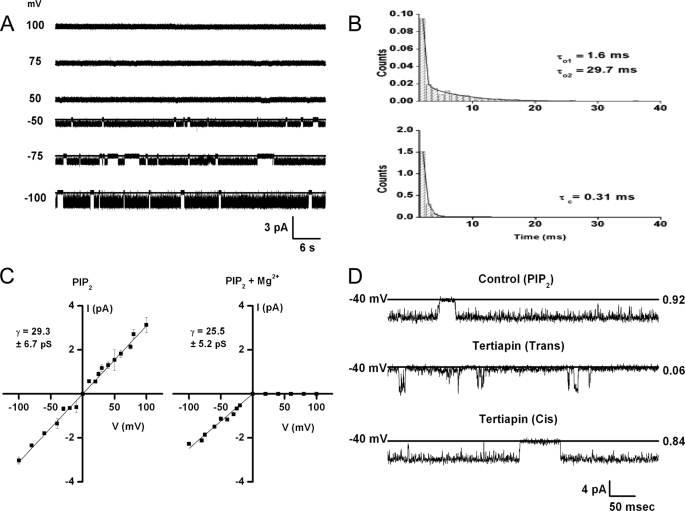
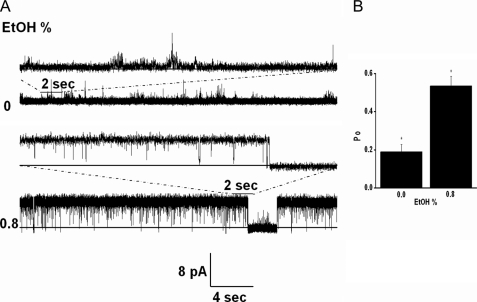
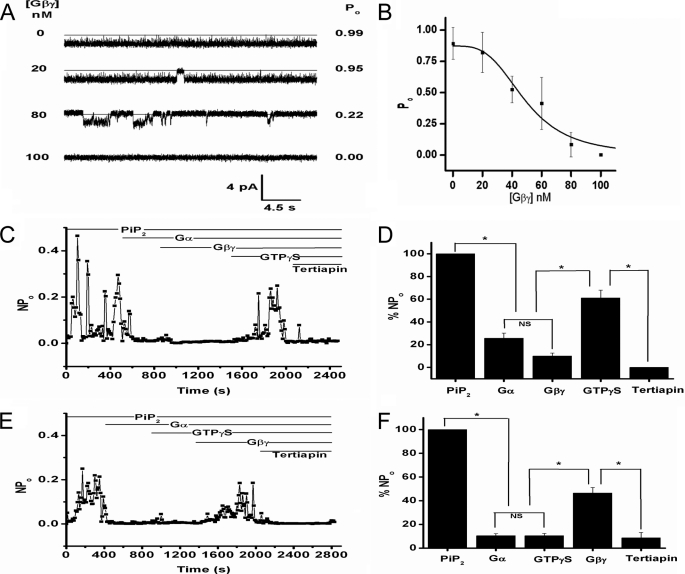
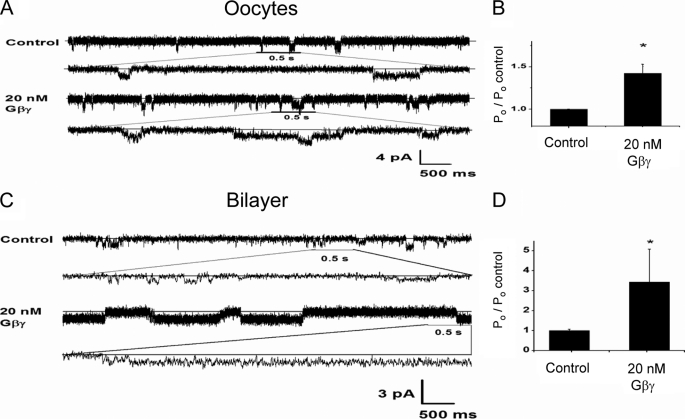
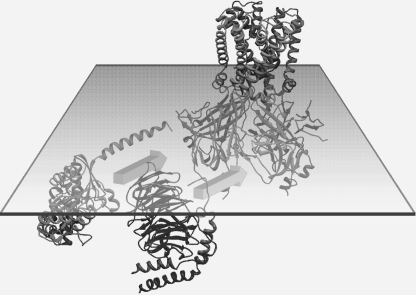
Kir3 channels control heart rate and neuronal excitability through GTP-binding (G) protein and phosphoinositide signaling pathways. These channels were the first characterized effectors of the βγ subunits of G proteins. Because we currently lack structures of complexes between G proteins and Kir3 channels, their interactions leading to modulation of channel function are not well understood. The recent crystal structure of a chimera between the cytosolic domain of a mammalian Kir3.1 and the transmembrane region of a prokaryotic KirBac1.3 (Kir3.1 chimera) has provided invaluable structural insight. However, it was not known whether this chimera could form functional K(+) channels. Here, we achieved the functional reconstitution of purified Kir3.1 chimera in planar lipid bilayers. The chimera behaved like a bona fide Kir channel displaying an absolute requirement for PIP(2) and Mg(2+)-dependent inward rectification. The channel could also be blocked by external tertiapin Q. The three-dimensional reconstruction of the chimera by single particle electron microscopy revealed a structure consistent with the crystal structure. Channel activity could be stimulated by ethanol and activated G proteins. Remarkably, the presence of both activated Gα and Gβγ subunits was required for gating of the channel. These results confirm the Kir3.1 chimera as a valid structural and functional model of Kir3 channels.


Figures

FIGURE 1.
FIGURE 1.
Single particle EM of the Kir3.1 channel chimera. A, representative field view of the negatively stained Kir3.1 chimera. The inset displays a gallery of characteristic particles. B, reference-free class averages produced by MLF2D, after five cycles of alignment and classification, to produce a working set of 19,300 particles. The percentage of particle images in each class is denoted. Out of 20 possible class averages, the particles in the dataset populated mainly seven classes. C, three-dimensional structure of the Kir3.1 chimera filtered to a resolution of 24 Å. Different views of the calculated isosurface contoured at 3 sigma are shown. D, fitting of the x-ray structure of the Kir3.1 channel chimera (PDB code: 2QKS) inside a cutaway of the volume. The locations of the transmembrane (TM) and cytoplasmic regions (CYT) are given. The region filled with dots around the TM region is suggested to correspond to DDM detergent molecules.
FIGURE 2.
FIGURE 2.
Functional reconstitution of the Kir3.1 chimera requires PIP2. A, 2-s traces of the Kir3.1 chimera reconstituted in a planar lipid bilayer in which 20 μm diC8-PIP2 was added from the Trans side (top) or the Cis side (bottom). B, dose-response curve of DiC8-PIP2 applied from the Cis side. Data points represent mean ± S.E. from four experiments ran in triplicate were fitted to the equation: y = B × xn/{(k)n + xn}, where y = Po; x = [PIP2]; B = 1.07 ± 0.05; EC50, k = 16.75 ± 0.50; Hill coefficient, n = 5.54 ± 0.77; chi2 = 0.00214. C, holding potential values (left), 10-s representative traces (middle), and open probability values (right) of the reconstituted chimera in the presence of 20 μm diC8-PIP2. Control (upper trace), 300 μg/ml polylysine added to the Trans side (middle trace) or to the Cis side (lower trace), n = 3. D, holding potential values (left), 20-s representative traces (center) and open probability values (right) of the Kir3.1 chimera activity in the presence of 20 μm diC8-PIP2. Control (upper trace), 1:200 dilution PIP2 Ab added to the Trans side (middle) or 1:200 dilution PIP2 Ab added to the Cis side, n = 3.
FIGURE 3.
FIGURE 3.
Functional properties of Kir3.1 chimera are consistent with a Mg2+-dependent inwardly rectifying channel, sensitive to block by extracellular Tertiapin Q. A, 1-min representative traces of the Kir3.1 chimera reconstituted in a planar lipid bilayer. B, intra-burst time constants for the experiment depicted in A. The open-time histogram (upper) was best fitted with a 2-component exponential and the closed-time histogram (lower) was best fitted with a one-component exponential (see text and figure for values). C, current-voltage relationship for the Kir3.1 chimera reconstituted in the absence of Mg2+ (left) or in the presence of 1 mm Mg2+, n = 3. D, 0.5 s representative traces of the chimera reconstituted under the same conditions as in A in the presence of 20 μm diC8-PIP2 (control, upper trace) or when 100 nm Tertiapin Q was added to the Trans side (middle trace) or to the Cis side (lower trace), n = 4.
FIGURE 4.
FIGURE 4.
Ethanol stimulates Kir3.1 chimeric currents. A, low concentrations of diC8-PIP2 (∼5 μm) were used to give minimal channel activity in symmetrical 150 mm KCl solutions in the absence of Mg2+ ions. 0.8% ethanol (174 μm, Cis side) stimulated channel activity. The representative traces shown were collected at 10 kHz and were additionally filtered at 1 kHz. The top trace was recorded at +25 mV, while the bottom trace at +200 mV. B, summary data from three experiments showing channel open probability (Po) at 0% versus 0.8% ethanol. The data were analyzed with one way ANOVA and the means comparison, using the Bonferroni test, showed statistical significance at p < 0.05.
FIGURE 5.
FIGURE 5.
G protein regulation of Kir3.1 chimeric currents. A, Gβγ concentrations (left), 30-s representative traces (center) and open probability (right) for the chimera in the presence of 20 μm diC8-PIP2 at the Gβγ concentrations depicted on the left. The traces shown come from the same experiment and were collected at 10 kHz and were additionally filtered at 1 kHz for final analysis. B, Gβγ dose-response on the open probability of the Kir3.1 chimera (n = 5) reconstituted under the same conditions as in A. Data points were fitted to the equation: y = B × xn/{(k)n + xn} where, y = Po; x = [Gβγ]; B = 0.87 ± 0.08; EC50, k = 48.97 ± 5.91; Hill coefficient, n = −3.31 ± 1.06; chi2 = 0.00865. C, representative NPo of the Kir3.1 chimera as a function of time for the entire experiment (n = 4). The bars at the top indicate the sequential addition of PIP2 (14.5 μm), Gα-GDP (40 nm), Gβγ (42 nm), GTPγS (100 μm), and Tertiapin Q (100 nm). All additions except for Tertiapin were added to the Cis side of the chamber. D, bar graph of the mean NPo (± S.E.) for the time interval between sequential additions of PIP2, Gα-GDP, Gβγ, GTPγS, and Tertiapin Q (n = 4). Asterisk (*) indicates significance level of 0.05 (see “Experimental Procedures”). E, representative NPo of Kir3.1 chimera as a function of time for an entire experiment (n = 3). The bars at the top indicate the sequential addition of PIP2, Gα-GDP, GTPγS, Gβγ, and Tertiapin Q (concentrations were similar to those indicated in C). All reagents except Tertiapin Q were added to the Cis side of the chamber. F, bar graph of the mean NPo (±S.E.) for the time interval between sequential additions of PIP2, Gα, GTPγS, Gβγ, and Tertiapin Q (n = 3). All reagents except Tertiapin Q were added to the Cis side of the chamber. The asterisk (*) indicates significance level of 0.05.
FIGURE 6.
FIGURE 6.
Gβγ stimulation of Kir3.1* activity in inside-out patches or bilayers using membranes from Xenopus oocytes. A, single-channel current traces in an inside-out patch of Kir3.1* expressed in oocytes for Control and after perfusion with 20 nm Gβγ in the bath. Current traces are also displayed at an expanded time scale. Membrane potential was held at −160 mV. B, summary data for the effect of Gβγ on Kir3.1* activity when expressed in oocytes (plotted as % of the control). The means comparison using the Student's t test showed statistical significance at p < 0.01. C, representative 6.5-s traces of membranes from oocytes expressing Kir3.1* reconstituted in the lipid bilayer. Similar conditions were used for oocyte membranes as was used for Kir3.1 chimera reconstitution in the absence or presence of 20 nm Gβγ on the Cis side. D, Gβγ effect on open probability (plotted as % of the control) for five experiments ran under the same conditions as in C. The means comparison using the Student's t test showed statistical significance at p < 0.05.
FIGURE 7.
FIGURE 7.
Model of G protein subunit stimulation of the Kir3.1 chimera. Structures of the Kir3.1 chimera, the Gα-GDP, and Gβγ, in the plane of the inner leaflet of the membrane bilayer, are shown. Both Gα-GDP and Gβγ, can interact independently or in combination to inhibit PIP2-stimulated channel activity, while the same holds true for Gα-GTPγS. However, in the presence of Gα-GTPγS, Gβγ stimulates the activity of the Kir3.1 chimera.

References

    1. Huang C. L., Feng S., Hilgemann D. W. (1998) Nature 391, 803–806 - PubMed
    1. Sui J. L., Petit-Jacques J., Logothetis D. E. (1998) Proc. Natl. Acad. Sci. U.S.A. 95, 1307–1312 - PMC - PubMed
    1. Logothetis D. E., Lupyan D., Rosenhouse-Dantsker A. (2007) J. Physiol. 582, 953–965 - PMC - PubMed
    1. Logothetis D. E., Kurachi Y., Galper J., Neer E. J., Clapham D. E. (1987) Nature 325, 321–326 - PubMed
    1. Reuveny E., Slesinger P. A., Inglese J., Morales J. M., Iñiguez-Lluhi J. A., Lefkowitz R. J., Bourne H. R., Jan Y. N., Jan L. Y. (1994) Nature 370, 143–146 - PubMed

Publication types

MeSH terms

Substances

LinkOut - more resources