. 2010 Dec 3;285(49):38674-83.
doi: 10.1074/jbc.M110.183343. Epub 2010 Oct 11.

Ca2+ release to lumen from ADP-sensitive phosphoenzyme E1PCa2 without bound K+ of sarcoplasmic reticulum Ca2+-ATPase

Affiliations

Ca2+ release to lumen from ADP-sensitive phosphoenzyme E1PCa2 without bound K+ of sarcoplasmic reticulum Ca2+-ATPase

Kazuo Yamasaki et al. J Biol Chem. .

Abstract

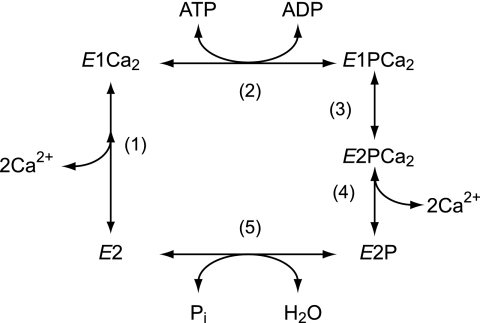
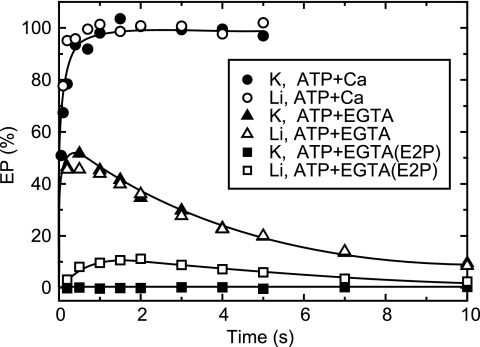
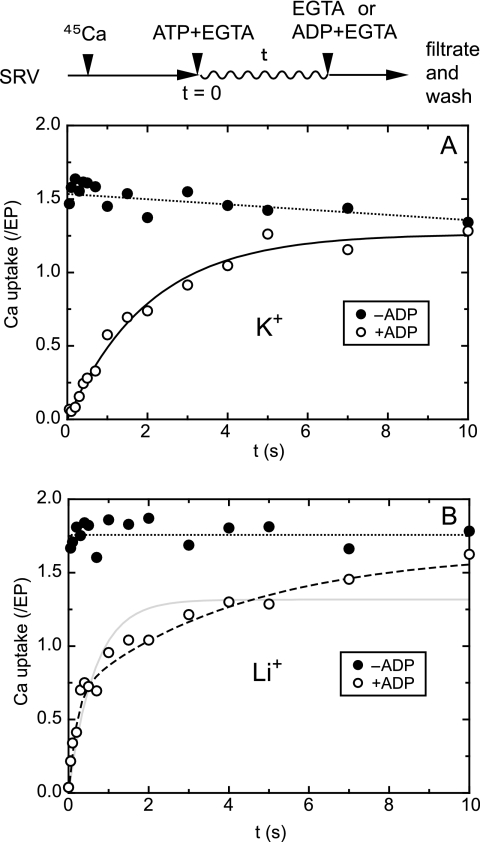
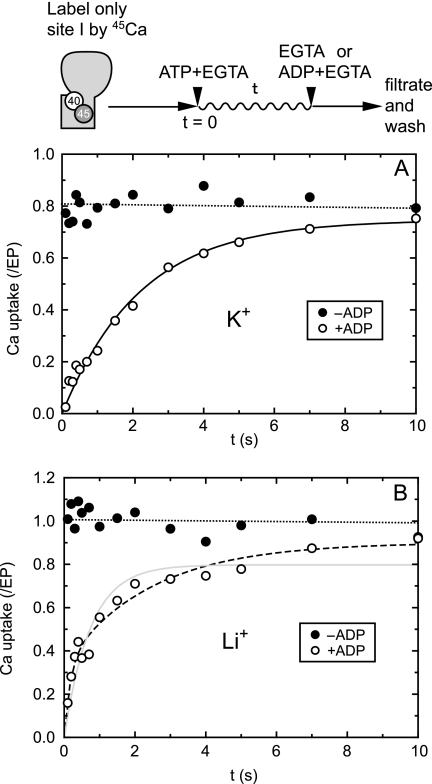
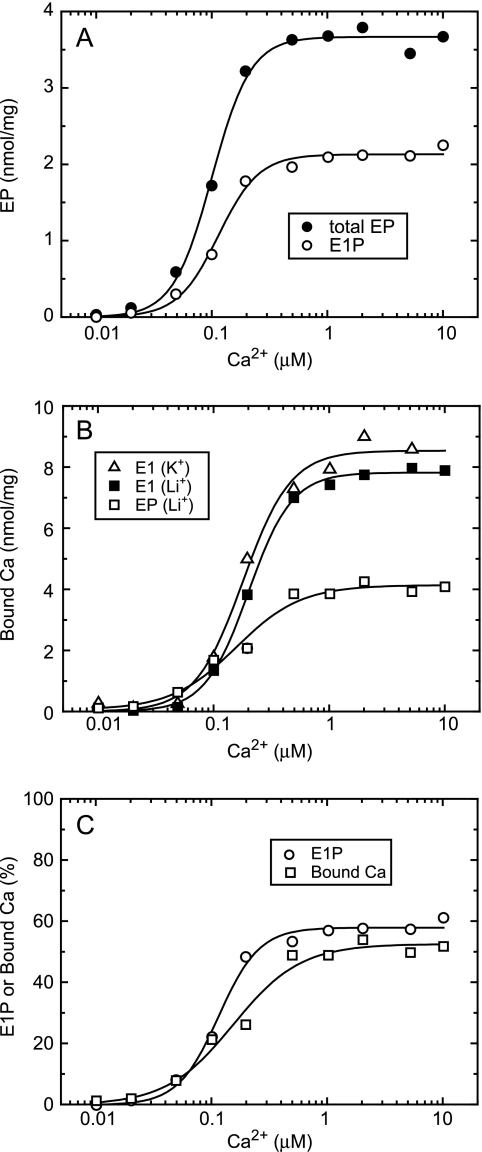
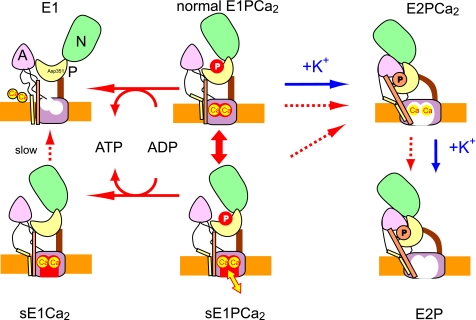
During Ca(2+) transport by sarcoplasmic reticulum Ca(2+)-ATPase, the conformation change of ADP-sensitive phosphoenzyme (E1PCa(2)) to ADP-insensitive phosphoenzyme (E2PCa(2)) is followed by rapid Ca(2+) release into the lumen. Here, we find that in the absence of K(+), Ca(2+) release occurs considerably faster than E1PCa(2) to E2PCa(2) conformation change. Therefore, the lumenal Ca(2+) release pathway is open to some extent in the K(+)-free E1PCa(2) structure. The Ca(2+) affinity of this E1P is as high as that of the unphosphorylated ATPase (E1), indicating the Ca(2+) binding sites are not disrupted. Thus, bound K(+) stabilizes the E1PCa(2) structure with occluded Ca(2+), keeping the Ca(2+) pathway to the lumen closed. We found previously (Yamasaki, K., Wang, G., Daiho, T., Danko, S., and Suzuki, H. (2008) J. Biol. Chem. 283, 29144-29155) that the K(+) bound in E2P reduces the Ca(2+) affinity essential for achieving the high physiological Ca(2+) gradient and to fully open the lumenal Ca(2+) gate for rapid Ca(2+) release (E2PCa(2) → E2P + 2Ca(2+)). These findings show that bound K(+) is critical for stabilizing both E1PCa(2) and E2P structures, thereby contributing to the structural changes that efficiently couple phosphoenzyme processing and Ca(2+) handling.


Figures

FIGURE 1.
FIGURE 1.
Reaction scheme of Ca2+-ATPase.
FIGURE 2.
FIGURE 2.
Time courses of EP decay and Ca2+ release in the presence or absence of 0.1 m K+. A, the Ca2+-ATPase in SR vesicles (20 μg protein/ml) was phosphorylated for 10 s with 100 μm [γ-32P]ATP in 10 μm nonradioactive CaCl2 (closed circles and, in inset, triangles), or with 100 μm nonradioactive ATP in 10 μm 45CaCl2 (open circles), 0.1 m KCl, 3 μm A23187. Then, 50 μl of the reaction mixture was spotted on the membrane and washed for the time periods on the abscissa with a chasing solution containing 1 mm EGTA, 0.1 m KCl, 3 μm A23187. The amount of bound 45Ca2+ (open circles) and the total amount of EP (open triangles in inset) were determined. The amounts of E2P (closed triangles in inset) were determined by a subsequent washing by a solution containing 1 mm ADP, 1 mm EGTA, and 0.1 m KCl. The amount of E1P (closed circles) was calculated by subtracting the amount of E2P from total amount of EP. B, the Ca2+-ATPase in SR vesicles was phosphorylated in the presence of 0.1 m KCl as in A and spotted on the filter. Then, the filter was washed with the EGTA solution (and subsequently with the ADP solution for the E2P determination) containing 0.1 m LiCl instead of KCl, otherwise as in A. Solid lines in A and B show the least squares fit to a single exponential. The rates (s−1) for E1P decay and the Ca2+ release were 0.66 and 0.58 (A) and 0.21 and 0.81 (B), respectively.
FIGURE 3.
FIGURE 3.
EP formation and decay in a single turnover. All of the solutions contained 0.1 m KCl (closed symbols) or LiCl (open symbols). SR vesicles (20 μg/ml) were incubated in 10 μm CaCl2, and EP formation was initiated by mixing with an equal volume of a solution containing 20 μm [γ-32P]ATP and 10 mm EGTA (triangles and squares) or 10 μm CaCl2 (circles). The total amount of EP was determined with the addition of trichloroacetic acid (circles and triangles). To determine the amount of E2P (squares), the phosphorylated sample was mixed with an equal volume of a solution containing 2 mm ADP and 5 mm EGTA, and then the reaction was terminated by trichloroacetic acid at 1 s after the ADP addition.
FIGURE 4.
FIGURE 4.
45Ca2+ uptake in a single turnover of EP with and without K+. All of the solutions contained 0.1 m KCl (A) or LiCl (B). In the absence of the Ca2+ ionophore, SR vesicles (SRV; 20 μg/ml) were first incubated with 10 μm 45CaCl2 for ∼10 min, and then Ca2+ uptake in a single turnover of EP was initiated by mixing with an equal volume of a solution containing 20 μm ATP and 2 mm EGTA, as described in Fig. 3. After the indicated periods, the reaction was chased with an equal volume of a solution containing 2 mm EGTA without (closed circles) or with (open circles) 2 mm ADP. The mixture was immediately spotted on the membrane and washed for ∼10 s with 1 ml of a 2 mm EGTA solution. The amount of 45Ca2+ on the membrane, i.e. transported into the vesicles and/or remained bound to the ATPase and not released to cytoplasmic side, was normalized to the maximum total amount of EP formed immediately after the addition ATP and EGTA (Fig. 3). In A, the time course obtained with the ADP chase was best described by a single exponential Ca2+ uptake (solid line) with a rate constant of 0.49 s−1 and maximum Ca2+/EP value of 1.26. In B, it was best described by a double exponential (broken line) with a rate constant and maximum Ca2+/EP value of 5.1 s−1 and 0.66 for the fast phase and 0.24 s−1 and 0.98 for the slow phase (but it was not described by a single exponential increase shown by solid line with the rate constant of 1.54 s−1 and maximum value of 1.31). Note also that without the ADP addition, almost of all the bound Ca2+ ions are transported into the vesicles during the ∼10-s EGTA wash because the single turnover of EP is nearly completed in this period (see Fig. 3).
FIGURE 5.
FIGURE 5.
Uptake of site I-bound 45Ca2+ in a single turnover of EP with and without K+. SR vesicles were incubated with 10 μm 45Ca2+ as in Fig. 4 and diluted by an equal volume of a solution containing 2 mm nonradioactive CaCl2 and 0.1 m KCl (A) or LiCl (B), and further incubated for 10 s. By this incubation, site I of the two Ca2+ sites (I, II) is labeled with 45Ca2+ due to Ca2+ exchange with site II (see supplemental Fig. S1) (42–44). Then, 45Ca2+ uptake assay in a single turnover was performed as in Fig. 4. In A, the time course obtained with the ADP-chase was best described by a single exponential Ca2+ uptake (solid line) with a rate constant of 0.45 s−1 and maximum Ca2+/EP value of 0.75. In B, it was best described by a double exponential increase (broken line) with a rate constant and maximum value of 6.0 s−1 and 0.34 for the fast phase and 0.41 s−1 and 0.56 for the slow phase (but not described by a single exponential increase shown as solid line with the rate constant of 1.36 s−1 and the maximum value of 0.80).
FIGURE 6.
FIGURE 6.
Ca2+ dependence of E1P accumulation and Ca2+ binding in steady state. A, SR vesicles (200 μg/ml) were phosphorylated at 4 °C for 30 s with 100 μm [γ-32P]ATP in 3 μm A23187, 0.1 m LiCl, and 20 μm CaCl2 with various concentrations of EGTA to give the indicated free Ca2+ concentrations. The total amount of EP (closed circles) and amount of E1P (open circles) were determined as described in Fig. 3. Solid lines show the least squares fit to the Hill equation. The maximum, K0.5, and Hill coefficient for the total amount of EP were 3.67 nmol/mg, 0.10 μm, and 2.6, respectively, and those for E1P were 2.12 nmol/mg, 0.11 μm, and 2.5, respectively. B, SR vesicles were phosphorylated with 100 μm ATP (open squares) or incubated without ATP (closed squares and open triangles) in 20 μm 45CaCl2 with various concentrations of EGTA and 0.1 m LiCl (squares) or KCl (triangles), otherwise as described in A. Then, 50 μl of the reaction mixture was spotted on the membrane, and the amount of 45Ca2+ specifically bound to the ATPase was determined. Solid lines show the least squares fit to the Hill equation. The maximum, K0.5, and Hill coefficient were 8.54 nmol/mg, 0.18 μm, and 2.1 (open triangles), 7.82 nmol/mg, 0.20 μm, and 2.3 (closed squares), and 4.14 nmol/mg, 0.15 μm, and 1.5 (open squares). C, the amount of E1P (open circles) in A and that of bound 45Ca2+ under the phosphorylating condition (open squares) in B in the absence of K+ are replotted after normalization to the maximum total amount of EP and to the maximum 45Ca2+ binding under the nonphosphorylating condition (E1) in the absence of K+, respectively, and shown as % values. Solid lines show the least squares fit to the Hill equation, and the maximum values were 58% for E1P and 52% for bound 45Ca2+, respectively.
FIGURE 7.
FIGURE 7.
Schematic model for roles of K+ in EP processing and Ca2+ handling in Ca2+ transport. sE1PCa2 is an E1PCa2 species formed without K+ possessing a closed cytoplasmic gate and lumen-facing Ca2+ binding sites (an opened lumenal pathway) with high Ca2+ affinity (Fig. 6). sE1PCa2 is in rapid equilibrium with the normal E1PCa2. Here, s denotes silent because this species is apparently absent in the presence of K+ and also because the bound Ca2+ ions are not released to the cytoplasmic side even upon ADP-induced reverse dephosphorylation (to sE1Ca2) in contrast to the normal E1PCa2 reverse dephosphorylation. Actual active Ca2+ transport is achieved by a large reduction of the Ca2+ affinity during the normal sequence E1PCa2E2PCa2E2P + 2Ca2+ (blue arrows). The schematic is based on crystal structural models for the ADP-sensitive and -insensitive EP states and E1Ca2, with the positions of the cytoplasmic N, P, and A domains, and membrane (orange layer) being approximate. The Ca2+ sites in the transmembrane domain are depicted as occluded (closed cytoplasmic and lumenal gates) in normal E1PCa2, as lumen-facing and high Ca2+ affinity with the closed cytoplasmic gate in sE1PCa2 and sE1Ca2, and as lumenally opened with reduced Ca2+ affinity in E2P and E2PCa2 (immediately before the Ca2+ release).
FIGURE 8.
FIGURE 8.
Structure of E1PCa2 with bound K+. The crystal structure E1PCa2·AMPPN (Protein Data Bank code 3BA6) (22) is shown. Panel a, a space-filling model with K+ (blue), M3 (yellow), M4 (orange), L6–7 (lime), Pα1 (pink), Pα6/Pα7 (light purple), Glu732 (red and cyan), and A/M3-linker (dark gray). b, a schematic model with the view from the same direction as in a. K+ and Ca2+ are blue and red Van der Waals spheres, respectively. M3, M4, and M5 are yellow, orange, and light purple, respectively. The lower panels in a and b are the enlarged views of the areas surrounded by red broken line. In b, the coordination of K+ is shown by broken green lines. c, the helices for Ca2+ binding (M4, M5, M6, and M8) and K+ binding (Pα6/Pα7) and adjacent components (M3, M7, Pα1, and A/M3-linker) are depicted. A large red arrow suggests a possible motion of M3/M4L at the lumenal end to open the Ca2+ pathway. The residues involved in coordination of K+ and Ca2+ are depicted in ball and stick representation. Residues possibly forming interactions at the lumenal end (Tyr294, Tyr295, Lys297, and Glu785) are also depicted. The lower panel in c shows the view from the lumenal side.
FIGURE 9.
FIGURE 9.
Structural change during E1PCa2E2P + 2Ca2+ and movement of the K+ binding site. The structural change is modeled on the crystal structures with bound K+, E1PCa2·AMPPN, and E2·AlF4 (Protein Data Bank codes 3BA6 (22) and 1XP5 (20), respectively). The two structures are aligned with the static M8–10 helices. The approximate position of the transmembrane region (TM) is shown by green lines. The area indicated by red dashed lines in the whole molecule is enlarged in the lower panel. The motions of each of N, P, and A domains during E1PCa2·AMPPN → E2·AlF4 are indicated by curved arrows. Note that the K+ site with bound K+ on the P domain moves down to the Gln244 region on the A/M3-linker (blue arrow), thus likely cross-linking the P domain with the A/M3-linker. There are three critical interaction networks to realize and stabilize the compactly organized E2P structure. They are Tyr122 HC forming a hydrophobic interaction cluster (violet Van der Waals spheres), the Val200 loop (red loop), and TGES184 (blue loop) (10–13). Crystal structures of E2·BeF3 (21, 22), which are analogs of the E2P ground state (25), are not used here because they were formed without K+ (although the above noted changes are also seen with the E2·BeF3 crystals).

Similar articles

Cited by

References

    1. Hasselbach W., Makinose M. (1961) Biochem. Z. 333, 518–528 - PubMed
    1. Ebashi S., Lipmann F. (1962) J. Cell Biol. 14, 389–400 - PMC - PubMed
    1. Inesi G., Sumbilla C., Kirtley M. E. (1990) Physiol. Rev. 70, 749–760 - PubMed
    1. Møller J. V., Juul B., le Maire M. (1996) Biochim. Biophys. Acta 1286, 1–51 - PubMed
    1. MacLennan D. H., Rice W. J., Green N. M. (1997) J. Biol. Chem. 272, 28815–28818 - PubMed

Publication types

MeSH terms