. 2011 Mar 15;108 Suppl 1(Suppl 1):4592-8.
doi: 10.1073/pnas.1011383107. Epub 2010 Oct 11.

Human oral, gut, and plaque microbiota in patients with atherosclerosis

Affiliations

Human oral, gut, and plaque microbiota in patients with atherosclerosis

Omry Koren et al. Proc Natl Acad Sci U S A. .

Abstract

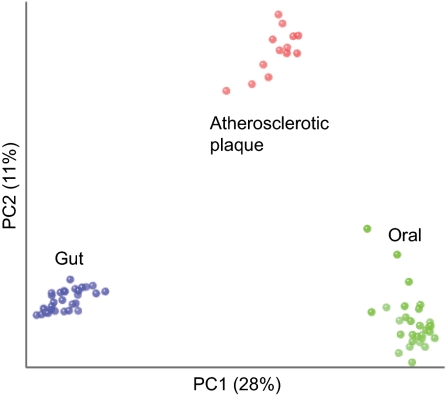
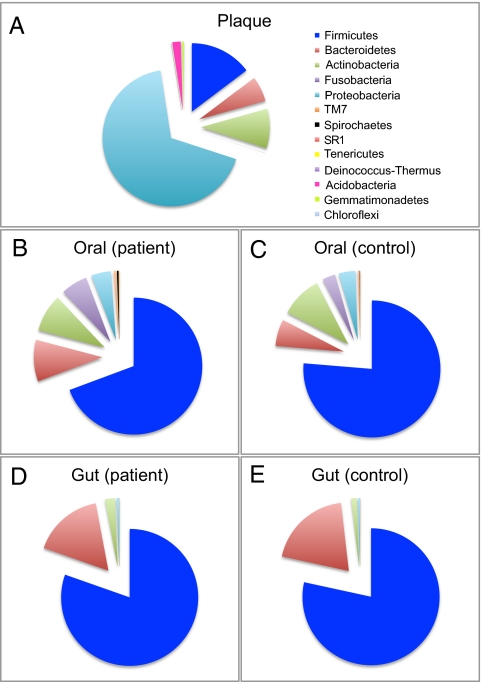
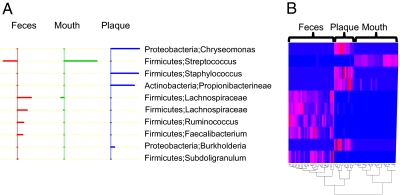
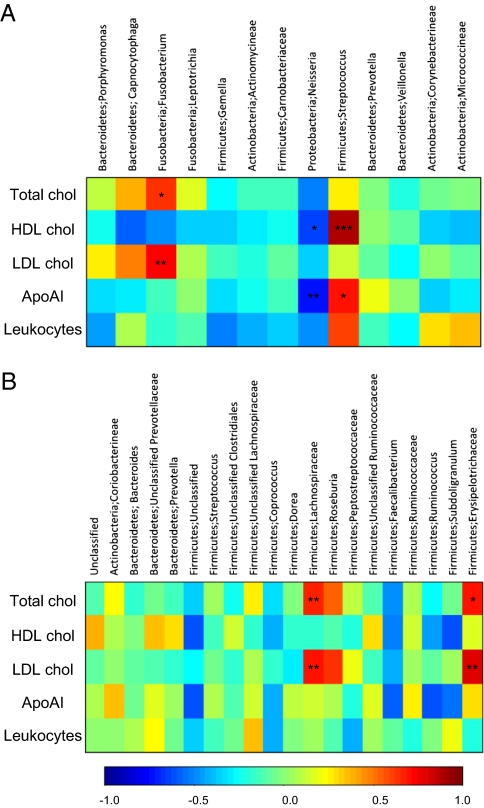
Periodontal disease has been associated with atherosclerosis, suggesting that bacteria from the oral cavity may contribute to the development of atherosclerosis and cardiovascular disease. Furthermore, the gut microbiota may affect obesity, which is associated with atherosclerosis. Using qPCR, we show that bacterial DNA was present in the atherosclerotic plaque and that the amount of DNA correlated with the amount of leukocytes in the atherosclerotic plaque. To investigate the microbial composition of atherosclerotic plaques and test the hypothesis that the oral or gut microbiota may contribute to atherosclerosis in humans, we used 454 pyrosequencing of 16S rRNA genes to survey the bacterial diversity of atherosclerotic plaque, oral, and gut samples of 15 patients with atherosclerosis, and oral and gut samples of healthy controls. We identified Chryseomonas in all atherosclerotic plaque samples, and Veillonella and Streptococcus in the majority. Interestingly, the combined abundances of Veillonella and Streptococcus in atherosclerotic plaques correlated with their abundance in the oral cavity. Moreover, several additional bacterial phylotypes were common to the atherosclerotic plaque and oral or gut samples within the same individual. Interestingly, several bacterial taxa in the oral cavity and the gut correlated with plasma cholesterol levels. Taken together, our findings suggest that bacteria from the oral cavity, and perhaps even the gut, may correlate with disease markers of atherosclerosis.


Conflict of interest statement

The authors declare no conflict of interest.

Figures

Fig. 1.
Fig. 1.
Bacterial diversity clustering by body habitat. The first two principal coordinates (PC1 and PC2) from the principal coordinate analysis of unweighted UniFrac are plotted for each sample. Each symbol represents a sample, colored by body habitat (green, oral cavity; red, atherosclerotic plaque; purple, gut). The variance explained by the PCs is indicated in parentheses on the axes.
Fig. 2.
Fig. 2.
Mean phylum abundances by body habitat for patients and controls. Plotted values are mean sequence abundances in each phylum for 1,700 randomly selected sequences per sample. (A) Atherosclerotic plaque; (B) oral cavity, patient; (C) oral cavity, control; (D) gut, patient; (E) gut, control.
Fig. 3.
Fig. 3.
Members of the microbiota that differ in abundance between the body sites. (A) Shrunken differences for the 10 genera accounting for the differences among the three body sites. For each genus listed in center, the direction of the horizontal bars indicates relative overrepresentation (Right) and underrepresentation (Left), and the length of the bar indicates the strength of the effect. (B) Heat map of the abundances of the classifying genera (i.e., those driving differences between body sites). Columns show, for each sample, the abundance data of genera listed in center. The abundances of the genera were clustered using unsupervised hierarchical clustering (blue, low abundance; red, high abundance). The phylum;genus of each of the classifying OTUs is noted.
Fig. 4.
Fig. 4.
Correlations between the abundances of different genera and disease markers in oral and fecal samples. Pearson correlation coefficients are represented by color ranging from blue, negative correlation (−1), to red, positive correlation (1). (A) OTUs from oral samples; (B) OTUs from fecal samples. Significant correlations are noted by *P < 0.05; **P < 0.01, and ***P < 0.001.

References

    1. Eckburg PB, et al. Diversity of the human intestinal microbial flora. Science. 2005;308:1635–1638. - PMC - PubMed
    1. Dethlefsen L, Eckburg PB, Bik EM, Relman DA. Assembly of the human intestinal microbiota. Trends Ecol Evol. 2006;21:517–523. - PubMed
    1. Turnbaugh PJ, et al. A core gut microbiome in obese and lean twins. Nature. 2009;457:480–484. - PMC - PubMed
    1. Costello EK, et al. Bacterial community variation in human body habitats across space and time. Science. 2009;326:1694–1697. - PMC - PubMed
    1. Grice EA, et al. NISC Comparative Sequencing Program Topographical and temporal diversity of the human skin microbiome. Science. 2009;324:1190–1192. - PMC - PubMed

Publication types

Substances