. 2010 Nov 2;107(44):18933-8.
doi: 10.1073/pnas.1007028107. Epub 2010 Oct 11.

Individuality in gut microbiota composition is a complex polygenic trait shaped by multiple environmental and host genetic factors

Affiliations

Individuality in gut microbiota composition is a complex polygenic trait shaped by multiple environmental and host genetic factors

Andrew K Benson et al. Proc Natl Acad Sci U S A. .

Abstract

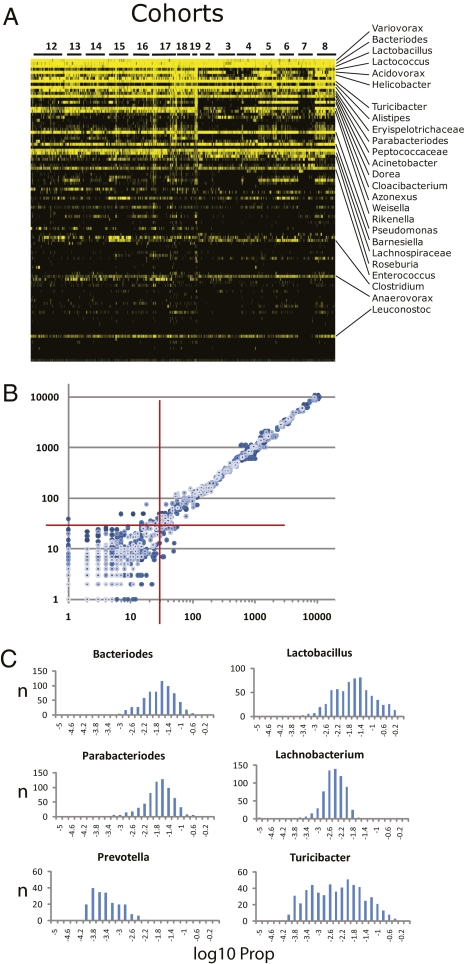
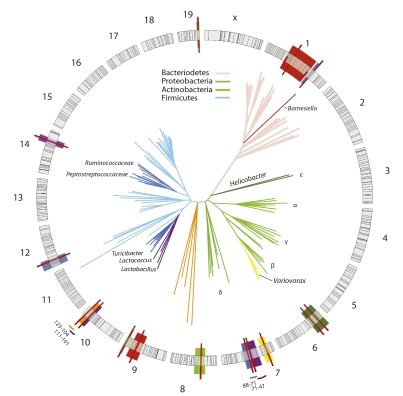
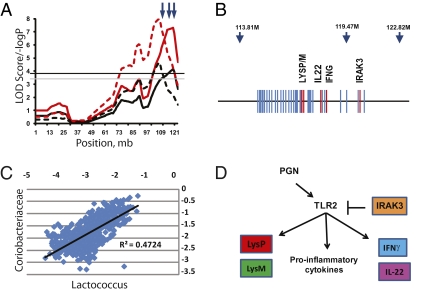
In vertebrates, including humans, individuals harbor gut microbial communities whose species composition and relative proportions of dominant microbial groups are tremendously varied. Although external and stochastic factors clearly contribute to the individuality of the microbiota, the fundamental principles dictating how environmental factors and host genetic factors combine to shape this complex ecosystem are largely unknown and require systematic study. Here we examined factors that affect microbiota composition in a large (n = 645) mouse advanced intercross line originating from a cross between C57BL/6J and an ICR-derived outbred line (HR). Quantitative pyrosequencing of the microbiota defined a core measurable microbiota (CMM) of 64 conserved taxonomic groups that varied quantitatively across most animals in the population. Although some of this variation can be explained by litter and cohort effects, individual host genotype had a measurable contribution. Testing of the CMM abundances for cosegregation with 530 fully informative SNP markers identified 18 host quantitative trait loci (QTL) that show significant or suggestive genome-wide linkage with relative abundances of specific microbial taxa. These QTL affect microbiota composition in three ways; some loci control individual microbial species, some control groups of related taxa, and some have putative pleiotropic effects on groups of distantly related organisms. These data provide clear evidence for the importance of host genetic control in shaping individual microbiome diversity in mammals, a key step toward understanding the factors that govern the assemblages of gut microbiota associated with complex diseases.


Conflict of interest statement

The authors declare no conflict of interest.

Figures

Fig. 1.
Fig. 1.
Characterization of the gut microbiota across the AIL population. (A) A heat map of the relative abundance of the top 100 genera identified in the G4 AIL population. Vertical columns represent individual animals; horizontal rows depict genera. Genera of interest are indicated. Black indicates absent taxa. (B) A scatterplot generated from pairwise combinations of data from technical repeats from five different samples. 16S rDNA from each sample was amplified with three different sets of bar-coded primers. Processed and filtered sequences from each barcode–sample combination were then assigned taxonomy by CLASSIFIER. Sequence counts for each taxonomic bin were log-transformed and plotted for all pairwise combinations of the three repeats for each sample. Axes are the log10-transformed values for total sequence reads of each taxon. The red crosshairs indicate the 30-read threshold. Above this number, correlation reaches >0.998: below this number, correlation dissipates rapidly. (C) Histograms of the frequency distribution of selected CMM taxa across the 645 animals. The histograms were plotted from log10-transformed values of the proportion (Prop) of sequence reads for each taxon (i.e., number of reads for that taxon/total sequence reads for a given animal). Thus, each histogram depicts the number of animals (y axis) with log10-transformed Prop values (x axis) for the given taxon.
Fig. 2.
Fig. 2.
QTL mapping of the murine gut microbiota. The circular diagram depicts the 19 murine autosomes and X chromosome drawn to scale. Black lines mark the positions of the SNPs used for QTL mapping. QTL confidence intervals are shaded in colors that correspond to the branches of the organism(s) in the phylogenetic tree. QTL peaks are marked by solid red lines. Color-coded bars outside the circle indicate confidence intervals of adjacent QTL. Coordinates of the confidence intervals (in Mb) are also indicated. The representative phylogenetic tree was derived from 100,000 sequences randomly drawn from the total data set of 5.2. The sampled sequences were clustered with CD-Hit; representative sequences of the most abundant 200 clusters were used for phylogenetic analysis by the neighbor-joining method. Major phyla are color-coded.
Fig. 3.
Fig. 3.
Fine structure of the genomic region of the significant QTL on chromosome 10. (A) The simple mapping output (red lines) and GRAIP permutation output (black lines) for QTL analysis of Coriobacteriaceae (solid lines) and Lactococcus (dashed lines). Genome-wide GRAIP-adjusted significance thresholds were generated from 50,000 permutations. Thus for the GRAIP output, a minimum possible P value with 50,000 permutations is 0.00002 (1/50,000), so the maximum −log P is 4.7. The black and gray horizontal lines represent the permuted 95% and 90% LOD thresholds, respectively. Arrows at the top show the relative positions of the three SNP markers nearest the QTL. (B) A scaled gene map of the QTL region. Arrows indicate SNP markers and their positions (in Mb). Genes are marked by blue; genes of interest are in red. (C) A scatterplot of log-transformed Prop values from the Coriobacteriaceae and the Lactococcus taxon bins of the 645 animals used in the study. (D) The combined functional pathways of the genes of interest in the QTL across multiple cell types. The bar from IRAK3 to TLR2 represents direct action. Arrows represent the relative influence of each gene and not necessarily direct gene action.

Comment in

References

    1. Tannock GW. What immunologists should know about bacterial communities of the human bowel. Semin Immunol. 2007;19:94–105. - PubMed
    1. Dethlefsen L, McFall-Ngai M, Relman DA. An ecological and evolutionary perspective on human-microbe mutualism and disease. Nature. 2007;449:811–818. - PMC - PubMed
    1. Ley RE, et al. Evolution of mammals and their gut microbes. Science. 2008;320:1647–1651. - PMC - PubMed
    1. Ley RE, Peterson DA, Gordon JI. Ecological and evolutionary forces shaping microbial diversity in the human intestine. Cell. 2006;124:837–848. - PubMed
    1. Antonopoulos DA, et al. Reproducible community dynamics of the gastrointestinal microbiota following antibiotic perturbation. Infect Immun. 2009;77:2367–2375. - PMC - PubMed

Publication types