. 2010 Oct 26;107(43):18354-9.
doi: 10.1073/pnas.1006282107. Epub 2010 Oct 11.

Persistence of climate changes due to a range of greenhouse gases

Affiliations

Persistence of climate changes due to a range of greenhouse gases

Susan Solomon et al. Proc Natl Acad Sci U S A. .

Abstract

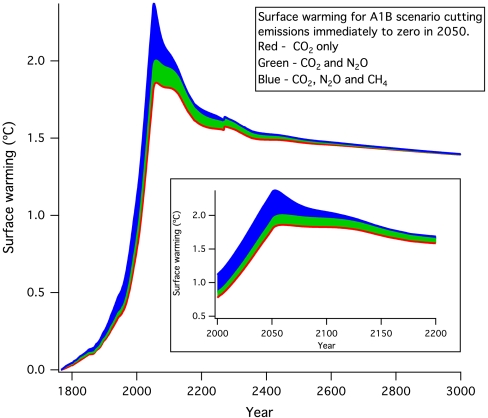
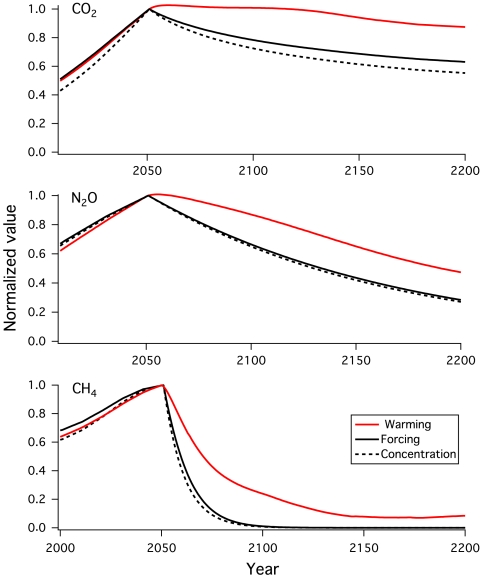
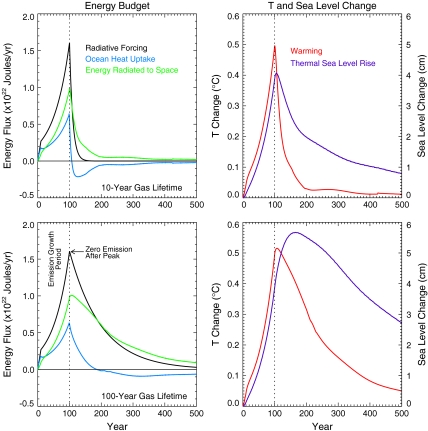
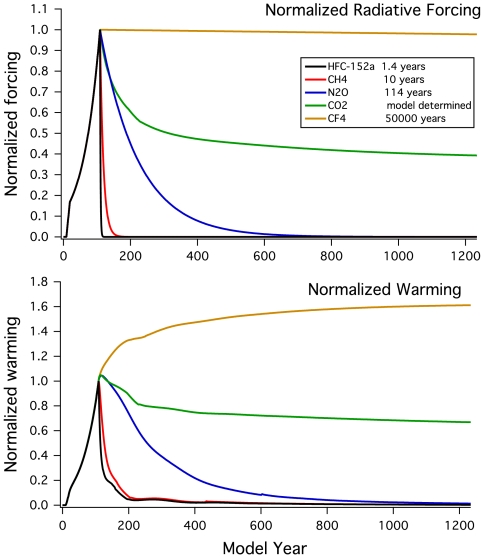
Emissions of a broad range of greenhouse gases of varying lifetimes contribute to global climate change. Carbon dioxide displays exceptional persistence that renders its warming nearly irreversible for more than 1,000 y. Here we show that the warming due to non-CO(2) greenhouse gases, although not irreversible, persists notably longer than the anthropogenic changes in the greenhouse gas concentrations themselves. We explore why the persistence of warming depends not just on the decay of a given greenhouse gas concentration but also on climate system behavior, particularly the timescales of heat transfer linked to the ocean. For carbon dioxide and methane, nonlinear optical absorption effects also play a smaller but significant role in prolonging the warming. In effect, dampening factors that slow temperature increase during periods of increasing concentration also slow the loss of energy from the Earth's climate system if radiative forcing is reduced. Approaches to climate change mitigation options through reduction of greenhouse gas or aerosol emissions therefore should not be expected to decrease climate change impacts as rapidly as the gas or aerosol lifetime, even for short-lived species; such actions can have their greatest effect if undertaken soon enough to avoid transfer of heat to the deep ocean.


Conflict of interest statement

The authors declare no conflict of interest.

Figures

Fig. 1.
Fig. 1.
Computed surface warming obtained in the Bern 2.5CC model due to CO2, CH4, and N2O emission increases to 2050 following a “midrange” scenario (called A1B; see ref. 23) followed by zero anthropogenic emissions thereafter. The gases are changed sequentially in this calculation in order to explicitly separate the contributions of each. The bumps shown in the calculated warming are due to changes in ocean circulation, as in previous studies (5, 26, 39). The main panel shows the contributions to warming due to CO2, N2O, and CH4. The inset shows an expanded view of the warming from year 2000 to 2200.
Fig. 2.
Fig. 2.
Relative changes in CO2 (Top), N2O (Middle) and CH4 (Bottom) concentrations, radiative forcings, and surface warmings, normalized to one at their peak values, for the A1B scenario to 2050, followed by an abrupt cessation of emissions (as in Fig. 1).
Fig. 3.
Fig. 3.
Energy budget terms calculated by the Bern 2.5CC model for an increase in radiative forcing from 0 to 1 W/m2 over 100 y and a subsequent decline in that forcing determined by a 10-y adopted gas lifetime (Upper) or 100-y gas lifetime (Lower). The left panels show instantaneous terms in the energy budget, whereas the right panels present the computed warming and sea level rise due to ocean thermal expansion only. The black lines show radiative forcing, whereas the pale-blue lines show ocean heat uptake. The difference between radiative forcing and ocean heat uptake is also shown as the pale-green lines, and this represents the energy emitted by the Earth–atmosphere system to space in response to the forcing. The modeled atmospheric temperature responses are represented by the red lines in the right panels, which track the instantaneous energy emitted by the Earth–atmosphere system.
Fig. 4.
Fig. 4.
Relative changes in radiative forcing (Upper) and warming (Lower) in the Bern 2.5CC model, for the same assumed profile of increasing radiative forcing over 100 y, followed by a stop of emissions as in Fig. 3, for a range of greenhouse gases of varying lifetimes. The gases considered are HFC-152a (1.4-y lifetime), methane (≈10-y lifetime), N2O (114-y lifetime), carbon dioxide (see text), and CF4 (50,000-y lifetime). All quantities are normalized to one when emissions stop, in order to examine relative changes.

References

    1. Forster P, et al. Changes in atmospheric constituents and in radiative forcing. In: Solomon S, et al., editors. Climate Change 2007: The Physical Science Basis. Cambridge, UK: Cambridge Univ Press; 2007. pp. 747–845.
    1. Matthews HD, Caldeira K. Stabilizing climate requires near-zero emissions. Geophys Res Lett. 2008;35:L04705. 10.1029/2007GL032388. - DOI
    1. Plattner GK, et al. Long-term climate commitments projected with climate-carbon cycle models. J Climate. 2008;21:2721–2751.
    1. Meehl GA, et al. Global climate projections. In: Solomon S, et al., editors. Climate Change 2007: The Physical Science Basis. Cambridge, UK: Cambridge Univ Press; 2007. pp. 747–845.
    1. Solomon S, Plattner G-K, Knutti R, Friedlingstein P. Irreversible climate change due to carbon dioxide emissions. Proc Natl Acad Sci USA. 2009;106:1704–1709. - PMC - PubMed

LinkOut - more resources