

Differences in HIV burden and immune activation within the gut of HIV-positive patients receiving suppressive antiretroviral therapy
- PMID: 20939732
- PMCID: PMC2997806
- DOI: 10.1086/656722
Differences in HIV burden and immune activation within the gut of HIV-positive patients receiving suppressive antiretroviral therapy
Abstract
Background: The gut is a major reservoir for human immunodeficiency virus (HIV) in patients receiving antiretroviral therapy (ART). We hypothesized that distinct immune environments within the gut may support varying levels of HIV.
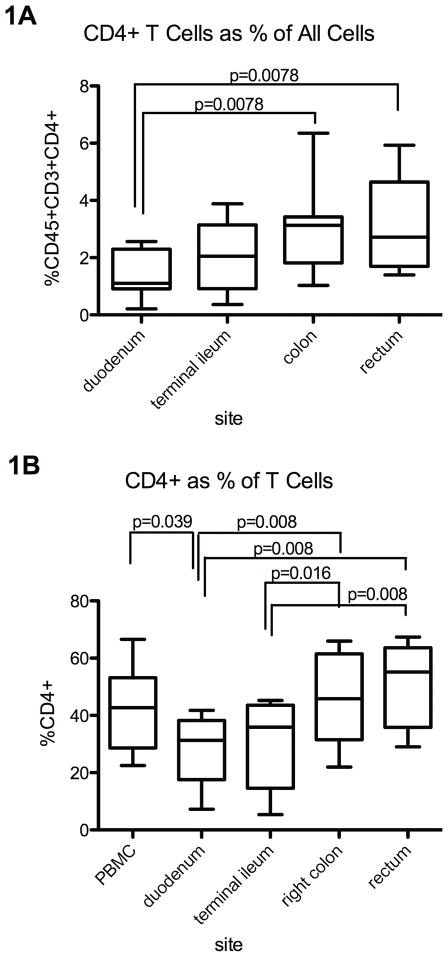
Methods: In 8 HIV-1-positive adults who were receiving ART and had CD4(+) T cell counts of >200 cells/μL and plasma viral loads of <40 copies/mL, levels of HIV and T cell activation were measured in blood samples and endoscopic biopsy specimens from the duodenum, ileum, ascending colon, and rectum.
Results: HIV DNA and RNA levels per CD4(+) T cell were higher in all 4 gut sites compared with those in the blood. HIV DNA levels increased from the duodenum to the rectum, whereas the median HIV RNA level peaked in the ileum. HIV DNA levels correlated positively with T cell activation markers in peripheral blood mononuclear cells (PBMCs) but negatively with T cell activation markers in the gut. Multiply spliced RNA was infrequently detected in gut, and ratios of unspliced RNA to DNA were lower in the colon and rectum than in PBMCs, which reflects paradoxically low HIV transcription, given the higher level of T cell activation in the gut.
Conclusions: HIV DNA and RNA are both concentrated in the gut, but the inverse relationship between HIV DNA levels and T cell activation in the gut and the paradoxically low levels of HIV expression in the large bowel suggest that different processes drive HIV persistence in the blood and gut.
Trial registration: ClinicalTrials.gov identifier: NCT00884793 (PLUS1).
Conflict of interest statement
No author has a commercial or other association that may pose a conflict of interest.
Figures


References
-
- Lampinen TM, Critchlow CW, Kuypers JM, et al. Association of antiretroviral therapy with detection of HIV-1 RNA and DNA in the anorectal mucosa of homosexual men. AIDS. 2000;14:F69–75. - PubMed
-
- Di Stefano M, Favia A, Monno L, et al. Intracellular and cell-free (infectious) HIV-1 in rectal mucosa. J Med Virol. 2001;65:637–43. - PubMed
-
- Anton PA, Mitsuyasu RT, Deeks SG, et al. Multiple measures of HIV burden in blood and tissue are correlated with each other but not with clinical parameters in aviremic subjects. Aids. 2003;17:53–63. - PubMed
-
- Poles MA, Boscardin WJ, Elliott J, et al. Lack of decay of HIV-1 in gut-associated lymphoid tissue reservoirs in maximally suppressed individuals. J Acquir Immune Defic Syndr. 2006;43:65–8. - PubMed
-
- Avettand-Fenoel V, Prazuck T, Hocqueloux L, et al. HIV-DNA in rectal cells is well correlated with HIV-DNA in blood in different groups of patients, including long-term non-progressors. AIDS. 2008;22:1880–2. - PubMed
Publication types
MeSH terms
Substances
Associated data
Grants and funding
LinkOut - more resources
Full Text Sources
Other Literature Sources
Medical
Research Materials
