. 2010 Oct 12:7:85.
doi: 10.1186/1742-4690-7-85.

Subtype-associated differences in HIV-1 reverse transcription affect the viral replication

Affiliations

Subtype-associated differences in HIV-1 reverse transcription affect the viral replication

Sergey Iordanskiy et al. Retrovirology. .

Abstract

Background: The impact of the products of the pol gene, specifically, reverse transcriptase (RT) on HIV-1 replication, evolution, and acquisition of drug resistance has been thoroughly characterized for subtype B. For subtype C, which accounts of almost 60% of HIV cases worldwide, much less is known. It has been reported that subtype C HIV-1 isolates have a lower replication capacity than B; however, the basis of these differences remains unclear.

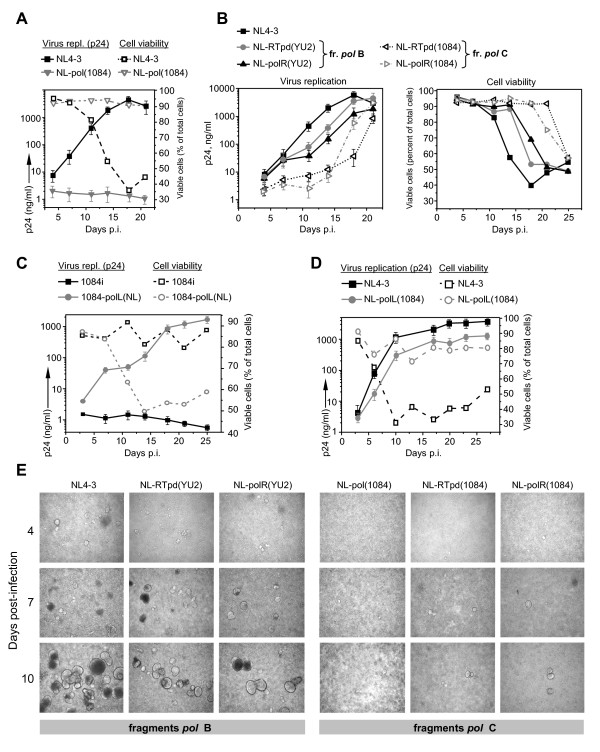
Results: We analyzed the impact of the pol gene products from HIV-1 B and C subtypes on the maturation of HIV virions, accumulation of reverse transcription products, integration of viral DNA, frequency of point mutations in provirus and overall viral replication. Recombinant HIV-1 viruses of B and C subtypes comprising the pol fragments encoding protease, integrase and either the whole RT or a chimeric RT from different isolates of the C and B subtypes, were used for infection of cells expressing CXCR4 or CCR5 co-receptors. The viruses carrying different fragments of pol from the isolates of B and C subtypes did not reveal differences in Gag and GagPol processing and viral RNA incorporation into the virions. However, the presence of the whole RT from subtype C, or the chimeric RT containing either the polymerase or the connection and RNase H domains from C isolates, caused significantly slower viral replication regardless of B or C viral backbone. Subtype C RT carrying viruses displayed lower levels of accumulation of strong-stop cDNA in permeabilized virions during endogenous reverse transcription, and decreased accumulation of both strong-stop and positive strand reverse transcription products in infected cells and in isolated reverse transcription complexes. This decreased accumulation correlated with lower levels of viral DNA integration in cells infected with viruses carrying the whole RT or RT domains from subtype C isolates. The single viral genome assay analysis did not reveal significant differences in the frequency of point mutations between the RT from B or C subtypes.

Conclusions: These data suggest that the whole RT as well as distinct polymerase and connection-RNase H domains from subtype C HIV-1 confer a lower level of accumulation of reverse transcripts in the virions and reverse transcription complexes as compared to subtype B, resulting in a lower overall level of virus replication.


Figures

Figure 1
Figure 1
Comparison of RT sequences of experimental subtype B and C isolates. All sequences of polymerase domain (AA residues 1-315) (A), connection (AA residues 316-437) and RNase H (AA residues 438-560) domains (B) are aligned with HIV-1 subtype B consensus (upper line). Functionally important RT regions are indicated by the colored boxes: grey - conservative regions: K65, R72 - coordinate triphosphate moiety of dNTPs; LPQG (149-152) - provide proper positioning of incoming dNTPs; LWMGYELH (228-235) - polymerase primer grip; GAH (359-361) - RNase H primer grip; pink - YMDD box: residues 183-186, essential for polymerase activity of RT; orange - catalytic Asp (polymerase and RNase H domains) and Glu (RNase H) residues; yellow - areas of high variability within subtypes. All conservative regions are indicated according to Coté and Roth, 2008 [25].
Figure 2
Figure 2
Generation of recombinant HIV-1 proviral clones comprising fragments of pol gene from subtype B and C isolates. Schematic presentation of the pol gene region of subtype B backbone NL4-3 (panel A) and subtype C backbone1084i (B) viruses, recombinant NL-based viruses (C-E and G), and recombinant 1084i-based construct (F). The indicated fragments of the gag-pol or pol genes from subtype B (isolates NL4-3 and YU-2) or subtype C (isolates 1084i, 1984i and 2669i) proviral DNA were PCR-amplified with primers containing sites of the indicated restriction endonucleases, and inserted into the linearized NL4-3 or HIV1084i proviral vectors to replace the homologous fragments. Selected molecular clones were used for transfection of 293T/17 cells to generate infectious recombinant virus strains.
Figure 3
Figure 3
Presence of the Gag and Pol domains from HIV-1 subtype C correlates with decreased level of virus replication. A - Kinetics of replication (solid lanes) and cytopathicity (dash lanes) of the backbone NL4-3 and chimeric NL-pol(1084) viruses in Sup-T1 cells. The cells (1 × 10⁶) were incubated with virus suspensions (0.01 pg of p24CA per cell) and then cultured in a fresh culture media. Ninety percent of the volume of cell suspensions were harvested every 3 to 4 days, and replaced with uninfected cells. HIV-1 p24CA levels were detected in culture supernatants at the indicated days after infection. Cell viability was measured in cell suspensions using trypan blue staining. Each curve indicating p24CA concentration in the culture media represents the mean data of two independent experiments. Error bars show the standard error. Each curve indicating cell viability represents data of one experiment. B - Kinetics of replication (left panel) and cytopathic effect (right panel) of the indicated NL4-3-based viruses in Sup-T1 cells. Infection with virus clones and cultivation of infected cells were performed as described in A. The p24CA curves represent the mean data ± SE from two independent experiments. The curves indicating cell viability represent data from one experiment. C - Kinetics of replication and cytopathic effect of the backbone 1084i and chimeric 1084ipolL(NL) viruses in U87.CD4.CCR5 cells. Each viral inoculum (MOI = 0.05) was added to 0.25 × 10⁶ cells. HIV-1 p24CA concentrations and cell viability were monitored at the indicated days. Each point represents mean p24CA level from two independent experiments. Error bars show the standard error. Each point indicating cell viability represents data of one experiment. D - Kinetics of replication (solid lanes) and the cytopathicity (dash lines) of the backbone NL4-3 and chimeric NL-polL(1084) viruses in Sup-T1 cells. Infection with virus clones and cultivation of infected cells were performed as in A. Each curve indicating p24CA concentration represents the mean data ± SE of two independent experiments. Each curve indicating cell viability represents data of one experiment. E - Syncytia formation by the Sup-T1 cells infected with the indicated virus strains. Live cells from the experiment described in A and B, maintained in 1 ml of culture medium, were subjected to phase-contrast microscopy on the indicated days after infection. One of ten representative images for each time point is shown.
Figure 4
Figure 4
Recombinant viruses containing the Gag and Pol domains from HIV-1 subtypes B and C do not have differences in RNA incorporation and GagPol processing. A - Quantitation of viral genomic RNA in virus particles. Virus particles were purified from the culture media of 293T/17 cells transfected with molecular clones of viruses at 48 h post-transfection, treated with DNase I RNase free for 2 h and concentrated by centrifugation through 30% sucrose. RNA was isolated from p24CA-normalized virus particles, subjected to the reverse transcription with oligo-dT primer and then to quantitative real-time PCR with the primer set specific for positive-strand HIV-1 DNA. The data of analysis of three independent viral preparations were quantified. Each point represents mean RNA copy number ± SD per 1 ng of p24CA in virus sample. B - Processing of Pr160GagPol polyprotein-precursor in the virus particles. The virus particles harvested from culture media of transfected 293T/17 cells and purified as in A were analyzed by Western blotting using the antibodies indicated in Materials and Methods. C - Quantification of Western blotting results. Western blotting data from two independent experiments were quantified using ImageJ software. Results show mean grey values of the bands ± SE and are presented as percentage of p24CA in each virus sample.
Figure 5
Figure 5
The presence of RT functional domains from HIV-1 subtype C leads to decreased cDNA accumulation. A - Endogenous reverse transcription (ERT) in permeabilized virions. Purified and p24CA-normalized virus particles of either the backbone NL4-3 or NL-based chimeric viruses were subjected to ERT with addition of dNTPs and permeabilizing agent melittin. Samples without dNTPs were used as a control. DNA was harvested after the indicated time of incubation. The relative amounts of negative-strand strong-stop DNA were measured using quantitative real-time PCR. Data from the control samples were subtracted. Levels of cDNA are shown as percentages of the peak accumulation detected in virions of NL4-3 at 5 h after initiation of incubation. Error bars show the standard deviation from three independent viral preparations. B - Accumulation of early or strong-stop viral DNA in Sup-T1 cells at 24 h p.i. Untreated or treated with 10 μM nevirapine cells were infected with backbone NL4-3 or the chimeric viruses, containing pol fragments from subtype C 1084i isolate using spinoculation. Relative amounts of reverse transcription products were measured using quantitative real-time PCR analysis of DNA from infected cells after incubation with or without 10 μM nevirapine. Data from nevirapine-treated samples were subtracted. Levels of cDNA are shown as percentages of the maximal accumulation detected for cDNA in cells infected with NL4-3 virus strain. Error bars show the standard deviation from three independent viral preparations. C - Accumulation of early and late reverse transcription products in Sup-T1 cells infected with recombinant viruses carrying protease and RT polymerase domain from 1084i, 2669i, and 1984i isolates of subtype C at 24 h p.i. The cells were infected with the indicated viruses as described in B. Harvested DNA was measured using quantitative real-time PCR analysis. Levels of cDNA are shown as percentages of the maximal accumulation detected for negative strand strong-stop cDNA in cells infected with NL4-3. Error bars indicate the standard deviation from three independent viral preparations.
Figure 6
Figure 6
The presence of RT polymerase domain from HIV-1 subtype C leads to decreased cDNA accumulation in reverse transcription complexes. Accumulation of strong-stop (A and C) and positive-strand (B and D) viral DNA in RTCs isolated at 1 and 5 h p.i. Sup-T1 cells were synchronously infected with MLV Env-pseudotyped backbone NL4-3 or chimeric NLpolL(1084) (A and B), and backbone HIV1084i or chimeric 1084polL(NL) viruses (C and D). RTCs were purified from cell lysates. DNA was isolated from RTCs and subjected to quantitative real-time PCR. Levels of cDNA are shown as percentages of the maximal accumulation detected for strong-stop cDNA in RTCs. Error bars show the standard deviation from three independent viral preparations.
Figure 7
Figure 7
Presence of RT functional domains from HIV-1 subtype C isolates correlates with decreased level of viral DNA integration. A - Integration of cDNA of NL4-3 or NL-based viruses carrying protease and RT polymerase domains from subtype C isolates in Sup-T1 cell DNA at 24 h p.i. Cells were infected as described in the legend to Figure 5B. Total DNA was harvested and relative amounts of proviral DNA were measured using two-step Alu-based nested PCR assays as described in Materials and methods. Levels of provirus are shown as percentages of the maximum levels of integration detected in cells infected with NL4-3. Error bars show the standard deviation of three independent viral preparations. B -Integration of the backbone NL4-3 and chimeric viruses in Sup-T1 cells at 24 and 48 h p.i. DNA from the infected cells was harvested and subjected to quantitative real-time PCR as described in A. Levels of proviral DNA are shown as percentage of those detected in cells infected with NL4-3 at 48 h p.i. Results are mean ± SD of three independent experiments.

Similar articles

Cited by

References

    1. Requejo HI. Worldwide molecular epidemiology of HIV. Rev Saude Publica. 2006;40:331–345. doi: 10.1590/S0034-89102006000200023. - DOI - PubMed
    1. Taylor BS, Sobieszczyk ME, McCutchan FE, Hammer SM. The challenge of HIV-1 subtype diversity. N Engl J Med. 2008;358:1590–1602. doi: 10.1056/NEJMra0706737. - DOI - PMC - PubMed
    1. de Oliveira T, Engelbrecht S, Janse van Rensburg E, Gordon M, Bishop K, zur Megede J, Barnett SW, Cassol S. Variability at human immunodeficiency virus type 1 subtype C protease cleavage sites: an indication of viral fitness? J Virol. 2003;77:9422–9430. doi: 10.1128/JVI.77.17.9422-9430.2003. - DOI - PMC - PubMed
    1. Korber BT, Allen EE, Farmer AD, Myers GL. Heterogeneity of HIV-1 and HIV-2. AIDS. 1995;9(Suppl A):S5–18. - PubMed
    1. Loemba H, Brenner B, Parniak MA, Ma'ayan S, Spira B, Moisi D, Oliveira M, Detorio M, Wainberg MA. Genetic divergence of human immunodeficiency virus type 1 Ethiopian clade C reverse transcriptase (RT) and rapid development of resistance against nonnucleoside inhibitors of RT. Antimicrob Agents Chemother. 2002;46:2087–2094. doi: 10.1128/AAC.46.7.2087-2094.2002. - DOI - PMC - PubMed

Publication types

MeSH terms

Substances