Discovery of gene network variability across samples representing multiple classes
- PMID: 20940126
- PMCID: PMC3321607
- DOI: 10.1504/IJBRA.2010.036002
Discovery of gene network variability across samples representing multiple classes
Abstract
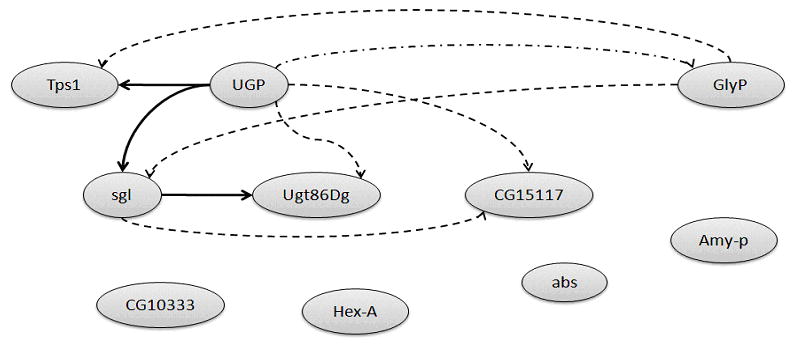
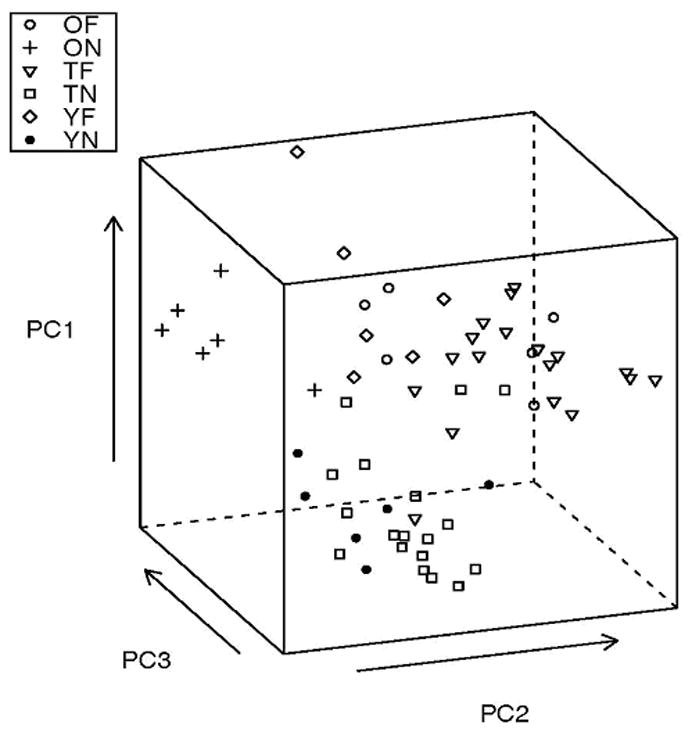
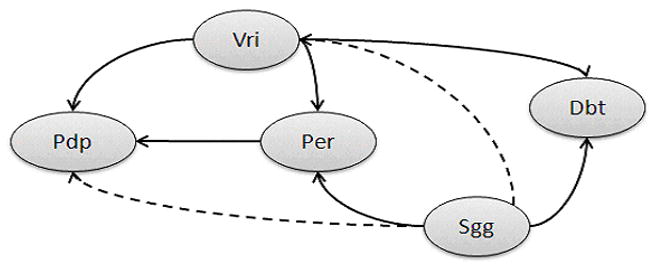
Gene networks have been predicted using the expression profiles from microarray experiments that include multiple samples representing each of several classes or states (e.g., treatments, developmental stages, health status). A framework that integrates Bayesian networks, mixture of gene co-expression models and clustering is proposed to further mine information from the variation of samples within and across classes and enhance the understanding of gene networks. The approach was evaluated on two independent pathways using data from two microarray experiments. Our algorithm succeeded on reconstructing the topology of the gene pathways when benchmarked against empirical reports and randomised data sets. The majority or all the samples within a class shared the same co-expression model and were classified within the corresponding class. Our approach uncovered both gene relationships and profiles that are unique to a particular class or shared across classes.
Figures
Similar articles
-
Inference of gene pathways using mixture Bayesian networks.BMC Syst Biol. 2009 May 19;3:54. doi: 10.1186/1752-0509-3-54. BMC Syst Biol. 2009. PMID: 19454027 Free PMC article.
-
A mixture model with random-effects components for clustering correlated gene-expression profiles.Bioinformatics. 2006 Jul 15;22(14):1745-52. doi: 10.1093/bioinformatics/btl165. Epub 2006 May 3. Bioinformatics. 2006. PMID: 16675467
-
Confident difference criterion: a new Bayesian differentially expressed gene selection algorithm with applications.BMC Bioinformatics. 2015 Aug 7;16:245. doi: 10.1186/s12859-015-0664-3. BMC Bioinformatics. 2015. PMID: 26250443 Free PMC article.
-
Methods for evaluating clustering algorithms for gene expression data using a reference set of functional classes.BMC Bioinformatics. 2006 Aug 31;7:397. doi: 10.1186/1471-2105-7-397. BMC Bioinformatics. 2006. PMID: 16945146 Free PMC article.
-
Unsupervised pattern recognition: an introduction to the whys and wherefores of clustering microarray data.Brief Bioinform. 2005 Dec;6(4):331-43. doi: 10.1093/bib/6.4.331. Brief Bioinform. 2005. PMID: 16420732 Review.
Cited by
-
Microarray analysis of natural socially regulated plasticity in circadian rhythms of honey bees.J Biol Rhythms. 2012 Feb;27(1):12-24. doi: 10.1177/0748730411431404. J Biol Rhythms. 2012. PMID: 22306970 Free PMC article.
-
Markov chain Monte Carlo simulation of a Bayesian mixture model for gene network inference.Genes Genomics. 2019 May;41(5):547-555. doi: 10.1007/s13258-019-00789-8. Epub 2019 Feb 11. Genes Genomics. 2019. PMID: 30741379
-
A model-based method for gene dependency measurement.PLoS One. 2012;7(7):e40918. doi: 10.1371/journal.pone.0040918. Epub 2012 Jul 19. PLoS One. 2012. PMID: 22829898 Free PMC article.
References
-
- Ciereszko I, Johansson H, Hurry V, Kleczkowski LA. Phosphate status affects the gene expression, protein content and enzymatic activity of UDP-glucose pyrophosphorylase in wild-type and pho mutants of Arabidopsis. Planta. 2001;212:598–605. - PubMed
-
- Davies S, Moore A. In: Mix-nets: Factored mixtures of Gaussians in Bayesian networks with mixed continuous and discrete variables. Kaufmann Morgan., editor. Uncertainty in Artificial Intelligence (UAI); 2000. pp. 168–175.
-
- Friedman N, Linial M, Nachman I, Pe’er D. Using Bayesian networks to analyze expression data. J Comput Biol. 2000;7:601–620. - PubMed
-
- Hartemink AJ, Gifford DK, Jaakkola TS, Young RA. Combining location and expression data for principled discovery of genetic regulatory network models. Pac Symp Biocomput. 2002:437–449. - PubMed
Publication types
MeSH terms
Grants and funding
LinkOut - more resources
Full Text Sources