. 2011 Jan;52(1):68-77.
doi: 10.1194/jlr.M009142. Epub 2010 Oct 11.

Selective knockdown of ceramide synthases reveals complex interregulation of sphingolipid metabolism

Affiliations

Selective knockdown of ceramide synthases reveals complex interregulation of sphingolipid metabolism

Thomas D Mullen et al. J Lipid Res. 2011 Jan.

Abstract

Mammalian ceramide synthases 1 to 6 (CerS1-6) generate Cer in an acyl-CoA-dependent manner, and expression of individual CerS has been shown to enhance the synthesis of ceramides with particular acyl chain lengths. However, the contribution of each CerS to steady-state levels of specific Cer species has not been evaluated. We investigated the knockdown of individual CerS in the MCF-7 human breast adenocarcinoma cell line by using small-interfering RNA (siRNA). We found that siRNA-induced downregulation of each CerS resulted in counter-regulation of nontargeted CerS. Additionally, each CerS knockdown produced unique effects on the levels of multiple sphingolipid species. For example, downregulation of CerS2 decreased very long-chain Cer but increased levels of CerS4, CerS5, and CerS6 expression and upregulated long-chain and medium-long-chain sphingolipids. Conversely, CerS6 knockdown decreased C16:0-Cer but increased CerS5 expression and caused non-C16:0 sphingolipids to be upregulated. Knockdown of individual CerS failed to decrease total sphingolipids or upregulate sphingoid bases. Treatment with siRNAs targeting combined CerS, CerS2, CerS5, and CerS6, did not change overall Cer or sphingomyelin mass but caused upregulation of dihydroceramide and hexosyl-ceramide and promoted endoplasmic reticulum stress. These data suggest that sphingolipid metabolism is robustly regulated by both redundancy in CerS-mediated Cer synthesis and counter-regulation of CerS expression.


Figures

Fig. 1.
Fig. 1.
CerS expression in MCF-7. MCF-7 cells were harvested and RNA was extracted for q-PCR analysis of CerS1-6 expression. q-PCR data are normalized to β-actin mRNA expression and data are mean ± SEM for three independent experiments.
Fig. 2.
Fig. 2.
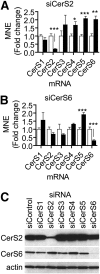
CerS2 and CerS6 downregulation by targeted siRNA causes multiple changes in nontargeted CerS mRNA levels. A and B: MCF-7 cells were transfected with 5 nM siRNA targeted against CerS (black bars) or siControl (white bars) for 48 h. Cells were harvested, and RNA was extracted for q-PCR analysis of expression of CerS1-6. q-PCR data are normalized to β-actin mRNA expression, and data are means ± standard errors of the mean (SEM) for three independent experiments. A: Effects of siCerS2 on CerS1-6 expression. B: Effects of siCerS6 on CerS1-6 expression. C: Western blot analysis of CerS2, CerS6, and β-actin protein expression following transfection with siCerS1-6. CerS2 and CerS6 were detected using monoclonal antibodies specific for these proteins. β-actin protein levels were used as a control for equal gel loading. *, P < 0.05; **, P < 0.01; ***, P < 0.01 versus siControl.
Fig. 3.
Fig. 3.
Knockdown of siCerS1-6 induces changes in multiple sphingolipid species. MCF-7 cells were transfected with 5 nM siRNA targeted against CerS1-6, and sphingolipid masses were determined by HPLC/MS. Sphingolipid levels were normalized to the amount of total lipid phosphate. A: Sphingolipid mass changes are displayed as a heat map of the log2 of the mean fold change versus siControl. Gray boxes indicate that the lipid was below detectable levels (BDL). Data represent three to five independent experiments. B: Mass of each sphingolipid class in siControl-transfected cells. C: Acyl chain distribution of each sphingolipid class displayed as mol%. Data represent the means of three to five independent experiments.
Fig. 4.
Fig. 4.
CerS2 downregulation results in a shift of sphingolipid distribution to predominantly long-chain species, resulting in the accumulation of C16:0-SM and long-chain glycosphingolipids. The effects of siCerS2 (black bars) on Cer (A), dHCer (B), SM (C), HexCer (D), and LacCer (E) compared with siControl (white bars) were determined as described in Fig. 4. Sphingolipid levels are normalized to the amount of total lipid phosphate. Data are means ± SEM for three to five independent experiments. *, P < 0.05; **, P < 0.01; ***, P < 0.01 versus siControl.
Fig. 5.
Fig. 5.
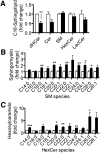
siCerS6 decreases C16:0-Cer/dHCer and increases multiple SM and HexCer species. The effects of siCerS6 (black bars) on C16:0-sphingolipids (A), SM species (B), and HexCer species (C) compared to siControl (white bars) were determined as described in Fig. 4. Sphingolipid levels are normalized to the amount of total lipid phosphate. Data are means ± SEM for three to five independent experiments. *, P < 0.05; **, P < 0.01; ***, P < 0.01 versus siControl.
Fig. 6.
Fig. 6.
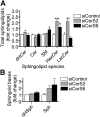
Knockdown of CerS2 or CerS6 increases total levels of a particular sphingolipid classes but does not significantly elevate sphingoid bases. MCF-7 cells were transfected with siCerS1-6 or siControl as described in Fig. 3, and total levels of different sphingolipid classes were determined by HPLC/MS. A: Total levels of dHCer, Cer, SM, HexCer, and LacCer were determined following CerS knockdown. B: dHSph and Sph levels were determined following CerS knockdown. Sphingolipid levels are normalized to the amount of total lipid phosphate. Data are means ± SEM for three to five independent experiments. *, P < 0.05; **, P < 0.01; ***, P < 0.01 versus siControl.
Fig. 7.
Fig. 7.
Treatment of of siCerS2, siCerS5, and siCerS6 combined increases dHCer and HexCer levels and causes elevation of Sph and S1P. The effects of combined treatment of siCerS2 (10 nM), siCerS5 (20 nM), and siCerS6 (10 nM) (siCerS2/5/6) on CerS2, CerS5, and CerS6 expression compared to siControl (40 nM) were analyzed by real-time q-PCR (A). Data are means ± SEM for six independent experiments. B: The effects of siCerS2/5/6 on total levels of dHCer, Cer, SM, HexCer, and LacCer were assessed by HPLC/MS. Data are means ± SEM for six independent experiments. C: Analysis of changes in individual HexCer species in response to siCerS2/5/6. Data are means ± SEM for six independent experiments. D: Changes in Sph and S1P content of cells treated with siCerS2/5/6 or siControl. Data are means ± SEM for six independent experiments. E: Effect of siCerS2/5/6 treatment on CHOP expression. Data are means ± SEM for five independent experiments. *, P < 0.05; **, P < 0.01; ***, P < 0.01 versus siControl.

Similar articles

Cited by

References

    1. Hannun Y. A., Obeid L. M. 2008. Principles of bioactive lipid signalling: lessons from sphingolipids. Nat. Rev. Mol. Cell Biol. 9: 139–150. - PubMed
    1. Taha T. A., Mullen T. D., Obeid L. M. 2006. A house divided: ceramide, sphingosine, and sphingosine-1-phosphate in programmed cell death. Biochim. Biophys. Acta. 1758: 2027–2036. - PMC - PubMed
    1. Zheng W., Kollmeyer J., Symolon H., Momin A., Munter E., Wang E., Kelly S., Allegood J. C., Liu Y., Peng Q., et al. 2006. Ceramides and other bioactive sphingolipid backbones in health and disease: lip­idomic analysis, metabolism and roles in membrane structure, dynamics, signaling and autophagy. Biochim. Biophys. Acta. 1758: 1864–1884. - PubMed
    1. Kitatani K., Idkowiak-Baldys J., Hannun Y. A. 2008. The sphingolipid salvage pathway in ceramide metabolism and signaling. Cell. Signal. 20: 1010–1018. - PMC - PubMed
    1. Sribney M. 1966. Enzymatic synthesis of ceramide. Biochim. Biophys. Acta. 125: 542–547. - PubMed

Publication types

LinkOut - more resources