. 2011 Jan 7;286(1):620-33.
doi: 10.1074/jbc.M110.188086. Epub 2010 Oct 12.

Negative regulation of EGFR-Vav2 signaling axis by Cbl ubiquitin ligase controls EGF receptor-mediated epithelial cell adherens junction dynamics and cell migration

Affiliations

Negative regulation of EGFR-Vav2 signaling axis by Cbl ubiquitin ligase controls EGF receptor-mediated epithelial cell adherens junction dynamics and cell migration

Lei Duan et al. J Biol Chem. .

Abstract

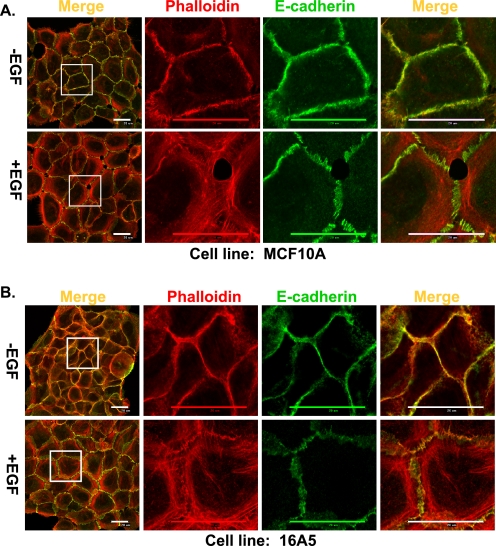
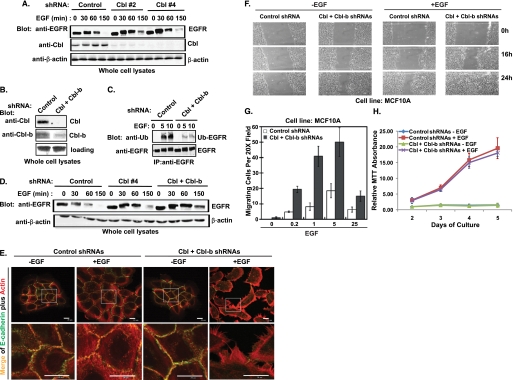
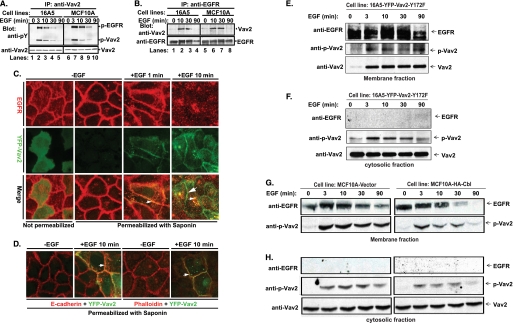
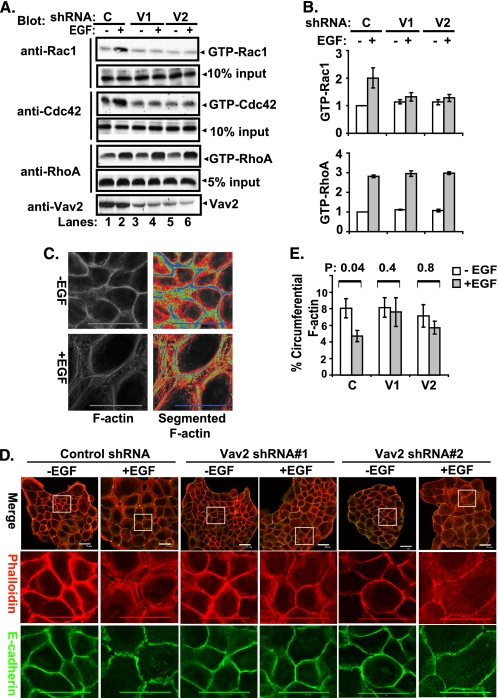
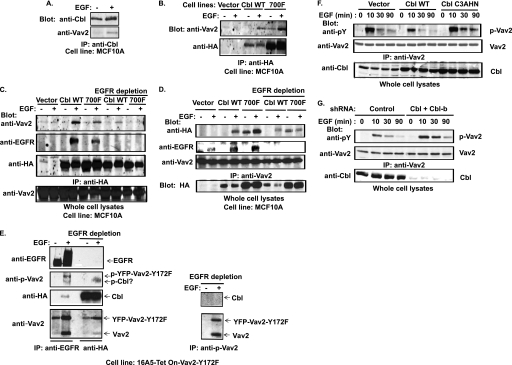
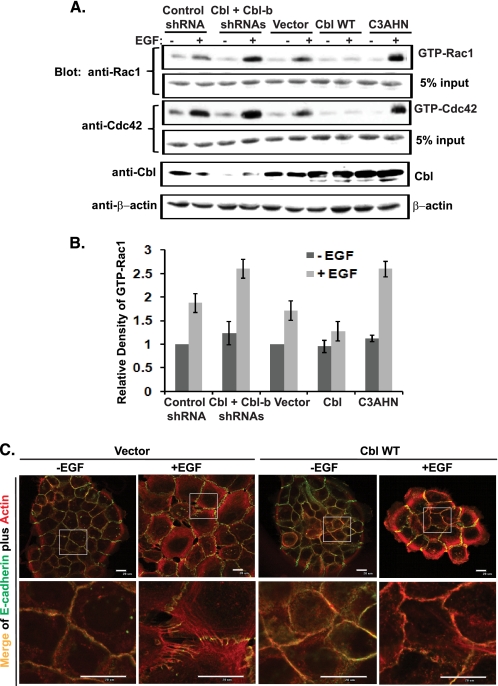
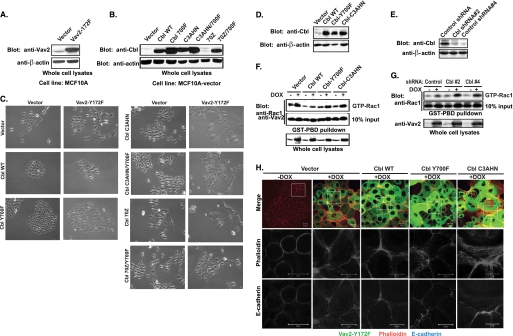
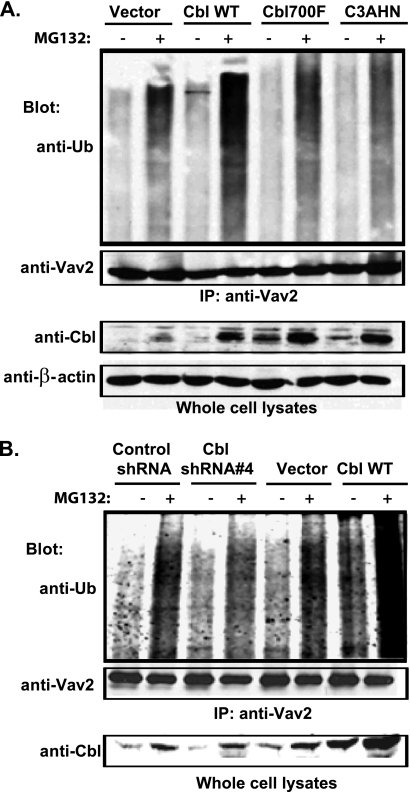
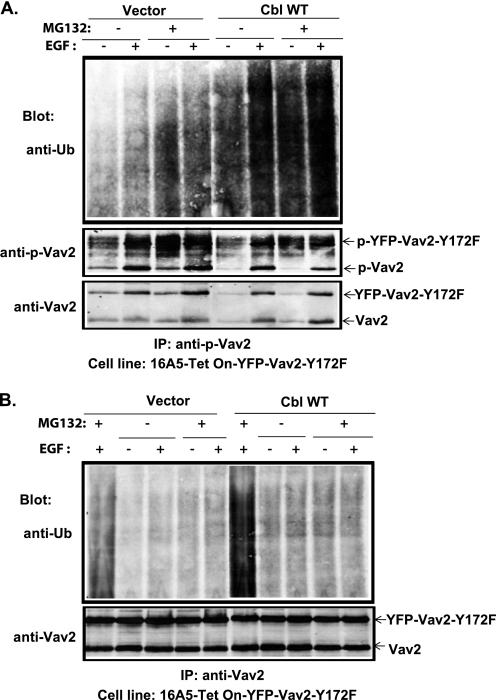
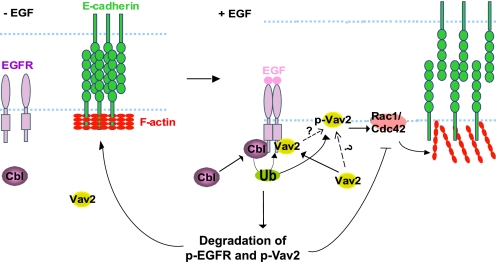
The E3 ubiquitin ligase Casitas B lymphoma protein (Cbl) controls the ubiquitin-dependent degradation of EGF receptor (EGFR), but its role in regulating downstream signaling elements with which it associates and its impact on biological outcomes of EGFR signaling are less clear. Here, we demonstrate that stimulation of EGFR on human mammary epithelial cells disrupts adherens junctions (AJs) through Vav2 and Rac1/Cdc42 activation. In EGF-stimulated cells, Cbl regulates the levels of phosphorylated Vav2 thereby attenuating Rac1/Cdc42 activity. Knockdown of Cbl and Cbl-b enhanced the EGF-induced disruption of AJs and cell motility. Overexpression of constitutively active Vav2 activated Rac1/Cdc42 and reorganized junctional actin cytoskeleton; these effects were suppressed by WT Cbl and enhanced by a ubiquitin ligase-deficient Cbl mutant. Cbl forms a complex with phospho-EGFR and phospho-Vav2 and facilitates phospho-Vav2 ubiquitinylation. Cbl can also interact with Vav2 directly in a Cbl Tyr-700-dependent manner. A ubiquitin ligase-deficient Cbl mutant enhanced the morphological transformation of mammary epithelial cells induced by constitutively active Vav2; this effect requires an intact Cbl Tyr-700. These results indicate that Cbl ubiquitin ligase plays a critical role in the maintenance of AJs and suppression of cell migration through down-regulation of EGFR-Vav2 signaling.


Figures

FIGURE 1.
FIGURE 1.
EGF stimulation of MECs results in remodeling of junctional actin cytoskeleton and disruption of AJs. MCF10A cells (A) and 16A5 cells (B) were grown without EGF for 4 days and stimulated with EGF (3 ng/ml) for 12 h. The cells were immunostained and scanned with confocal microscopy at the subapical plane for E-cadherin (green) or actin (phalloidin; red). Both the whole cell colony image and the high resolution image of the indicated areas in the colonies are presented (scale bar, 20 μm).
FIGURE 2.
FIGURE 2.
Knockdown of Cbl and Cbl-b in MECs decreases the EGF-induced EGFR ubiquitinylation and degradation, enhances the disruption of AJs and cell migration, but does not affect cell proliferation. A, MCF10A cells with stable expression of control shRNA, Cbl shRNA#2, and Cbl shRNA#4 were growth factor-starved for 3 days before stimulation with EGF (100 ng/ml) for the indicated time points. Whole cell lysates were immunoblotted for EGFR, Cbl, and β-actin. B, whole cell lysates of MCF10A cells with stable overexpression of control shRNAs or Cbl/Cbl-b shRNAs were immunoblotted for Cbl and Cbl-b. C, MCF10A cells with stable expression of control shRNAs or Cbl/Cbl-b shRNAs were growth factor-starved and stimulated with EGF (100 ng/ml) for the indicated time points. Cell lysates were subjected to IP with anti-an EGFR antibody and immunoblotted for ubiquitin (upper panel, Ub-EGFR) and EGFR (lower panel). D, MCF10A cells with control shRNA, Cbl shRNA (#4), or Cbl/Cbl-b shRNA expression were growth factor-starved for 3 days and stimulated with EGF (100 ng/ml) for the indicated time points. Whole cell lysates were immunoblotted for EGFR. E, MCF10A cells with control shRNA or Cbl/Cbl-b shRNA expression were growth factor-starved and then stimulated with EGF (3 ng/ml) for 12 h. The cells were immunostained with anti-E-cadherin antibodies (green) and phalloidin (red). Both the whole cell colony image and the high resolution image of the indicated areas in the colonies were acquired by confocal microscopy scanning at the subapical plane (scale bar, 20 μm). F, wound healing assay. MCF10A cells were grown to confluence and growth factor-starved for 72 h; a scratch wound was made with a micropipette tip (blue tip) and the edge of cells was marked. EGF (10 ng/ml) was then added to the starvation media, and cells were allowed to migrate toward the center of the wound and photographed at the indicated times (representative figure of three independent experiments). G, trans-well migration assay. Cells were growth factor-starved for 72 h, harvested, plated in the top chamber of trans-well plates (1 × 10⁴ per chamber in triplicate) on a fibronectin-coated surface with 8-μm pores, and allowed to attach for 4 h. EGF at the indicated concentrations (ng/ml) was added to starvation media in the bottom well, and cells that migrated to the bottom side of the filter in 16 h were scored. Mean values are presented with standard deviation indicated. H, MCF10A cells with control shRNA or Cbl/Cbl-b shRNA expression were grown in 96-well plates (2 × 10³/well) in octuplicates in DFCI media with or with EGF. MTT assay was done at the indicated days, and the average MTT absorbance values in each cell line were normalized to the non-EGF-treated cells harvested at day 2 and presented as a graph with standard deviation indicated (representative figure of three independent experiments). There is no statistically significant difference (p = 0.34) between the two groups.
FIGURE 3.
FIGURE 3.
EGF-induced phosphorylation of Vav2, association with EGFR, translocation of phospho-Vav2 to the cell membrane, and co-localization of Vav2 with EGFR, E-cadherin, or F-actin at cell-cell junctions. A, growth factor-starved 16A5 (lanes 1–5) or MCF10A (lanes 6–10) cells were stimulated with EGF (100 ng/ml). The whole cell lysates were immunoprecipitated (IP) with anti-Vav2 Abs and immunoblotted with anti-phosphotyrosine (pY) Abs and anti-Vav2 Abs or (B) IP with anti-EGFR Abs (clone 528) and immunoblot for Vav2 and EGFR. C, MCF10A cells with stable expression of YFP-Vav2 WT (green) were growth factor-starved and stimulated with EGF (100 ng/ml). The cells were either fixed directly (1st image from left) or permeabilized with saponin/PBS (10 μg/ml, 2nd to 4th images) for 10 min before fixation and then immunostained for EGFR (red). The yellow color indicates co-localization of YFP-Vav2 with EGFR (small arrowheads); the green color indicates cell junction-localized Vav2 (large arrowhead). D, cells were permeabilized as above and immunostained for E-cadherin (red, 1st and 2nd images from left) or F-actin (red, 3rd and 4th images). The yellow color indicates the co-localization of YFP-Vav2 with E-cadherin or F-actin (small arrowheads). E–H, growth factor-starved 16A5-YFP-Vav2–172F cells (E and F) or vector-expressing versus WT Cbl-overexpressing MCF10A cells (G and H) were stimulated with EGF (100 ng/ml) for the indicated time points. Whole cell lysates were subjected to subcellular fractionation. Membrane (E and G) and cytosolic (F and H) fractions were immunoblotted for EGFR, phospho-Vav2, and Vav2.
FIGURE 4.
FIGURE 4.
EGF-induced reorganization of junctional actin cytoskeleton through activation of Vav2-Rac1/Cdc42. A, control shRNA- (C, lanes 1 and 2), Vav2 shRNA#1- (V1, lanes 3 and 4), and Vav2 shRNA#2 (V2, lanes 5 and 6)-expressing cells were growth factor-starved for 72 h and stimulated with EGF (100 ng/ml) for 10 min. The whole cell lysates were subjected to GST-PBD or GST-RBD pulldown and immunoblotted for Rac1, Cdc42, or RhoA as indicated. The whole cell lysate input for pulldown was used as loading control and also blotted for Vav2 (lowest panel) (representative figure of three independent experiments). B, average relative density of GTP-bound forms of the Rac1 and RhoA from three experiments is presented as bars with standard deviation. C, quantification of junctional actin cytoskeleton reorganization. 3 × 10³ cells were grown on 20 × 20-mm glass coverslips in DFCI-1 media without EGF for 4 days until the cells formed discrete colonies; the cells were then stimulated with EGF (3 ng/ml) for 12 h before fixation. The cells were permeabilized with 0.5% Triton X-100, stained with Alexa Fluor 594-conjugated phalloidin, and scanned under a confocal microscope at the subapical plane to acquire the junctional F-actin images. To quantify the distribution and reorganization of junctional F-actin, the segmented histogram (Metamorph software) was used to subgroup the F-actin staining according to the fluorescence intensity. Two typical cell images were used as the gold standard to configure the segmentation criteria in terms of fluorescence intensity (FI), which subgroups the junctional F-actin into circumferential (blue, FI = 255–161), peri-junctional (green, FI = 160–101), diffuse (red, FI = 100–61), and background (black, FI = 61–0). The Bin areas of each group were acquired, and the total Bin areas excluding background were used as total F-actin area, and the percentage Bin area of the circumferential F-actin versus the total F-actin was calculated and graphed. D, 16A5 cells with stable expression of control shRNA or Vav2 shRNAs were growth factor-starved for 4 days and stimulated with EGF (3 ng/ml) for 12 h. The cells were immunostained for E-cadherin (green) and F-actin (red) and were scanned with confocal microscopy at the subapical plane to acquire images of the whole cell colonies or of the indicated areas. E, cells with or without EGF stimulation (3 ng/ml for 12 h) were analyzed by F-actin segmentation. The mean percentage of circumferential F-actin in each experimental group was calculated from randomly selected colonies (n = 19) and the mean percentages were compared by one-way analysis of variance and then by paired t test following a logarithmic transformation. The mean percentages of the circumferential F-actin are presented with standard errors as Y-error bars, and the p values are indicated above the paired bars.
FIGURE 5.
FIGURE 5.
EGF-induced Cbl-Vav2 association and Cbl-dependent attenuation of Vav2 phosphorylation. A, growth factor-starved MCF10A cells were stimulated with EGF (100 ng/ml) for 10 min, and anti-Cbl IPs from whole cell lysates were immunoblotted for Vav2 and Cbl. B, MCF10A cells with stable overexpression of HA-tagged wild type Cbl or Cbl-Y700F were stimulated with EGF (100 ng/ml) for 10 min and anti-HA IPs immunoblotted for Vav2. C, equal amount of cell lysates from the cells with vector or wild type Cbl overexpression and one-third amount of cell lysates from cells with Cbl-Y700F expression prepared under the same experimental conditions as described in B were subjected to IP (1st to 6th lanes) with anti-HA Abs as such or after immunodepletion of EGFR before (7th to 10th lanes) and then immunoblotted for Vav2, EGFR, and HA. D, equal amounts of cell lysates from vector-, wild type Cbl-, or Cbl-Y700F-overexpressing cells under the same experimental conditions as described in B were subjected to IP with anti-Vav2 Abs (1st to 6th lanes) or immunodepleted of EGFR before IP with anti-HA Abs (7th to 10th lanes) followed by immunoblotting for HA, EGFR, and Vav2. E, growth factor-starved and DOX-induced 16A5-Tet-On-Vav2-Y172F/HA-Cbl-expressing cells were treated with EGF (100 ng/ml) for 5 min. Equal amounts of cell lysates were subjected to serial (three times) anti-EGFR IP to immunodeplete EGFR (left panel, 1st and 2nd lanes) before IP with anti-HA (left panel, 3rd and 4th lanes) or with anti-phospho-Vav2 antibodies (right panel) and immunoblotted for EGFR, phospho-Vav2, Vav2, and HA. F, growth factor-starved MCF10A cells with stable overexpression of vector, wild type Cbl or Cbl-C3AHN mutant were stimulated with EGF (100 ng/ml) for the indicated time. Equal amounts of cell lysates were subjected to IP with anti-Vav2 Abs and immunoblotted for Tyr(P) (pY) and Vav2. Whole cell lysates were also blotted for Cbl (lowest panel). G, MCF10A cells with stable expression of control shRNAs or Cbl/Cbl-b shRNAs were stimulated with EGF (100 ng/ml). Cell lysates were subjected to IP with anti-Vav2 Abs and blotted for Tyr(P) (pY) and Vav2. Whole cell lysates were also immunoblotted for Cbl (lowest panel).
FIGURE 6.
FIGURE 6.
Role of Cbl in attenuating Rac1 and Cdc42 activation and remodeling of cell-cell junctions in response to EGF stimulation of MECs. A, MCF10A cells with stable expression of control shRNAs, Cbl/Cbl-b shRNAs (right panel), vector, wild type Cbl, or Cbl-C3AHN were stimulated with EGF (100 ng/ml) for 10 min. Cell lysates were subjected to GST-PBD pulldown and immunoblotted for Rac1 and Cdc42 (representative figure of three independent experiments). B, average density of the GTP-bound Rac1 from three independent experiments is presented as a bar graph with S.D. as error bars. C, growth factor-starved MCF10A cells with stable overexpression of vector or wild type Cbl were stimulated with EGF (100 ng/ml) for 12 h. The cells were immunostained with anti-E-cadherin Abs (green) and phalloidin (red). Both whole cell colony image and the high resolution image of the indicated areas in the colonies were acquired by confocal microscopy scanning at the subapical plane.
FIGURE 7.
FIGURE 7.
Suppression of the constitutively active Vav2-Y172F mutant-mediated morphological transformation, activation of Rac1, and reorganization of junctional actin cytoskeleton by WT Cbl but not by E3-deficient mutants. A, whole cell lysates of MCF10A cells with stable expression of vector or Vav2-Y172F mutant were Western-blotted for Vav2. B, lysates of MCF10A cells with stable transduction of vector, wild type Cbl, or Cbl mutants were Western-blotted for Cbl. C, vector- or Vav2-Y172F-expressing MCF10A cells were stably transduced with vector, wild type Cbl, or Cbl mutants and selected with antibiotics for 2 weeks. The selected cells were trypsinized and replated at low density and cultured for 1 week. Cells were photographed with a phase-contrast light microscope under transmitted light. D–H, whole cell lysates of 16A5-Tet-On-172F cells with stable expression of vector, wild type Cbl, Cbl-Y700F, and Cbl-C3AHN (D) or stable expression of control shRNA, Cbl shRNA#2, and Cbl shRNA#4 (E) were immunoblotted for Cbl and β-actin. The cells were treated with vehicle or DOX for 3 days to induce Vav2 expression, and whole cell lysates were subjected to GST-PBD pulldown assay and immunoblotted for Rac1 (F and G). H, 16A5-Tet-On-172F cells with stable expression of vector, wild type Cbl, Cbl-Y700F, and Cbl-C3AHN were grown in DFCI media without EGF and treated with vehicle or DOX for 3 days. The cells were immunostained with anti-E-cadherin Abs (blue) and phalloidin (red). Both whole cell colony image and the high resolution image of the indicated areas in the colonies were acquired by confocal microscopy scanning at the subapical plane.
FIGURE 8.
FIGURE 8.
Role of Cbl in Vav2 ubiquitinylation. 16A5-Tet-On-172F cells with stable expression of vector, wild type Cbl (A and B), Cbl-Y700F, or Cbl-C3AHN (A) or stable expression of control shRNA or Cbl-shRNA#4 (B) were treated with DOX for 3 days to induce the expression of Vav2-Y172F. The cells were then treated with DMSO or MG132 (100 μm) for 4 h before lysis. Cell lysates were subjected to IP with anti-Vav2 Abs and immunoblotted for ubiquitin (Ub) and Vav2. Whole cell lysates were also blotted for Cbl.
FIGURE 9.
FIGURE 9.
Enhancement of phospho-Vav2 ubiquitinylation by WT Cbl. 16A5-Tet-On-172F cells stably expressing vector or wild type Cbl were treated with DOX for 2 days to induce expression of Vav2-Y172F and then growth factor-starved for 2 days. The cells were then treated with DMSO or MG132 (20 μm) for 1 h before stimulation with EGF (100 ng/ml) for 10 min. The cells were lysed in RIPA buffer and cell lysates depleted of EGFR by two serial rounds of anti-EGFR IP. The EGFR-depleted lysates were subsequently subjected to IP with anti-phospho-Vav2 antibody. Finally, the post-phospho-Vav2 IP cell lysates (phospho-Vav2-depleted) were subjected to IP with anti-Vav2 antibody (B 2nd to 5th and 7th to 10th lanes). The anti-phospho-Vav2 (A, upper panel) and the Vav2 IPs (B, 1st and 6th lanes are IPs of whole cell lysates) were immunoblotted for ubiquitin (Ub) and reprobed for phospho-Vav2 and Vav2 (A, middle and lower panels and B, lower panel).
FIGURE 10.
FIGURE 10.
Model of Cbl-dependent stabilization of AJs in EGF-stimulated MECs through negative regulation of EGFR and Vav2 signaling. MECs form AJs by E-cadherin clustering, which is facilitated by tight circumferential actin cables. EGFR phosphorylates Vav2 that translocates to the cell membrane at the cell-cell junctions and activates Rac1/Cdc42 that reorganizes junctional actin, resulting in de-clustering of E-cadherin and disruption of cell-cell adhesions. Attenuation of Rac1/Cdc42 activation is partially achieved by Cbl-mediated ubiquitinylation of EGFR resulting in attenuation of phosphorylated Vav2. Cbl can additionally lead to ubiquitinylation (Ub) and degradation of p-Vav2 resulting in its removal from the junctional membrane, therefore temporally and spatially restricting Rac1/Cdc42 activation and reorganization of junctional actin cytoskeleton. This attenuation is hypothesized to serve as a physiological barrier to prevent excessive reorganization of junctional actin cytoskeleton and complete loss of AJs during EGF-induced MEC remodeling process.

References

    1. Wells A. (1999) Int. J. Biochem. Cell Biol. 31, 637–643 - PubMed
    1. Yarden Y., Sliwkowski M. X. (2001) Nat. Rev. Mol. Cell Biol. 2, 127–137 - PubMed
    1. Arteaga C. (2003) Semin. Oncol. 30, Suppl. 7, 3–14 - PubMed
    1. Jost M., Kari C., Rodeck U. (2000) Eur. J. Dermatol. 10, 505–510 - PubMed
    1. Yarden Y. (2001) Eur. J. Cancer 37,S3–S8 - PubMed

Publication types

MeSH terms