. 2010 Dec 31;285(53):41795-805.
doi: 10.1074/jbc.M110.149229. Epub 2010 Oct 12.

Protein kinase C phosphorylation regulates membrane insertion of GABAA receptor subtypes that mediate tonic inhibition

Affiliations

Protein kinase C phosphorylation regulates membrane insertion of GABAA receptor subtypes that mediate tonic inhibition

Armen M Abramian et al. J Biol Chem. .

Abstract

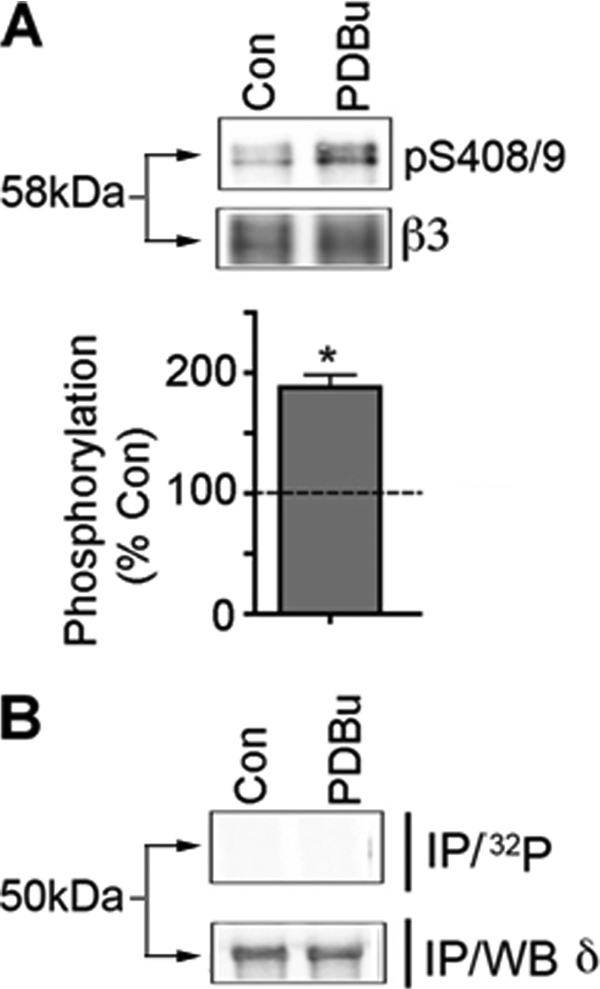
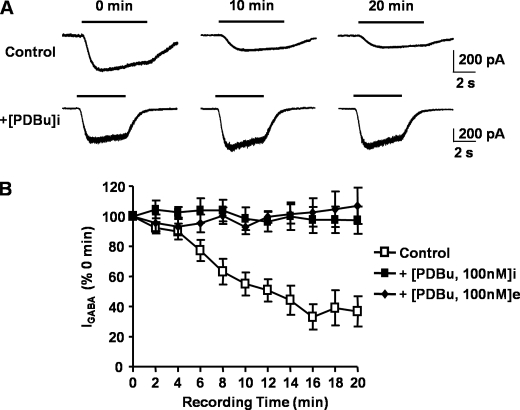
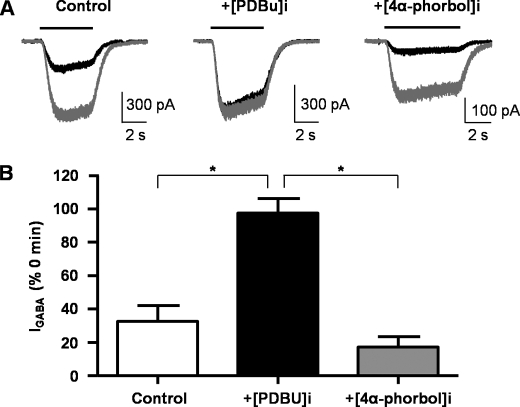
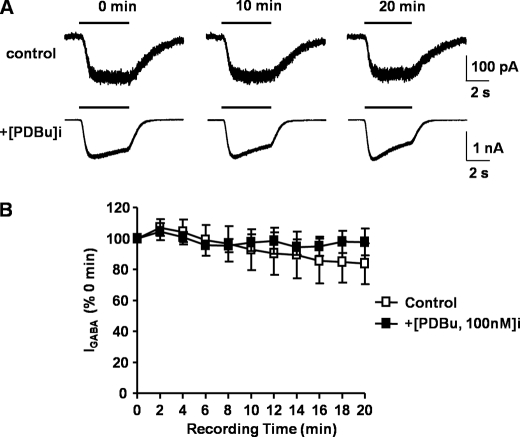
Tonic inhibition in the brain is mediated largely by specialized populations of extrasynaptic receptors, γ-aminobutyric acid receptors (GABA(A)Rs). In the dentate gyrus region of the hippocampus, tonic inhibition is mediated primarily by GABA(A)R subtypes assembled from α4β2/3 with or without the δ subunit. Although the gating of these receptors is subject to dynamic modulation by agents such as anesthetics, barbiturates, and neurosteroids, the cellular mechanisms neurons use to regulate their accumulation on the neuronal plasma membrane remain to be determined. Using immunoprecipitation coupled with metabolic labeling, we demonstrate that the α4 subunit is phosphorylated at Ser(443) by protein kinase C (PKC) in expression systems and hippocampal slices. In addition, the β3 subunit is phosphorylated on serine residues 408/409 by PKC activity, whereas the δ subunit did not appear to be a PKC substrate. We further demonstrate that the PKC-dependent increase of the cell surface expression of α4 subunit-containing GABA(A)Rs is dependent on Ser(443). Mechanistically, phosphorylation of Ser(443) acts to increase the stability of the α4 subunit within the endoplasmic reticulum, thereby increasing the rate of receptor insertion into the plasma membrane. Finally, we show that phosphorylation of Ser(443) increases the activity of α4 subunit-containing GABA(A)Rs by preventing current run-down. These results suggest that PKC-dependent phosphorylation of the α4 subunit plays a significant role in enhancing the cell surface stability and activity of GABA(A)R subtypes that mediate tonic inhibition.


Figures

FIGURE 1.
FIGURE 1.
α4 subunit phosphorylation is increased by PDBu, a specific PKC activator. A, untransfected COS-7 cells (UT) or COS-7 cells transfected with GABAA receptor α4 and β3 subunits were labeled with 0.5 mCi/ml [32P]orthophosphoric acid and then treated with either PDBu (500 nm for 10 min) alone or following pretreatment with GFX (1 μm for 10 min), a PKC inhibitor. The α4 subunit was immunoprecipitated, subjected to SDS-PAGE, and visualized with autoradiography (top). The level of phosphorylation was normalized to the amount observed in vehicle-treated samples (bottom) (dashed line represents vehicle set at 100%, p < 0.05). B, phosphopeptide map of the α4 subunit. [32P]α4 immunopurified from transfected COS-7 cells was digested with trypsin, and the resulting phosphopeptides were blotted onto TLC plates and subjected to electrophoresis followed by ascending chromatography. The small arrow indicates the origin. C, the α4 subunit was subjected to phosphoamino acid analysis followed by autoradiography. The migration of phosphoserine (pS), phosphothreonine (pT), and phosphotyrosine (pY) standards is indicated. Error bars, S.E.
FIGURE 2.
FIGURE 2.
PKC-dependent phosphorylation of the α4 subunit occurs within a PKC consensus motif. A, schematic depicting the protein structure of the α4 subunit. Examination of the intracellular domain (ICD) between transmembrane domains 3 and 4 (TM3 and TM4) reveals a serine that is located in a PKC consensus motif. B, untransfected COS-7 cells (UT) or COS-7 cells co-transfected with either wild-type (α4-WT) or S443A mutant (α4-S443A) GABAA receptor α4 and β3 subunits were labeled with [32P]orthophosphoric acid and treated with PDBu (500 nm for 10 min). Detergent-soluble extracts were immunoprecipitated with anti-α4, resolved by SDS-PAGE, and then visualized by autoradiography (top). The histogram is presented as 32P incorporation expressed as a percentage of vehicle-treated control (bottom) (dashed line represents vehicle set at 100%, p < 0.05). Error bars, S.E.
FIGURE 3.
FIGURE 3.
PKC-dependent phosphorylation on Ser443 regulates the cell surface expression of the α4 subunit in COS-7 cells. A, COS-7 cells transfected with GABAA receptor α4 and β3 subunits were treated with either PDBu (500 nm for 10 min) alone or following pretreatment with GFX (1 μm for 10 min) and then labeled with NHS-SS-biotin. Detergent-soluble extracts were then purified on NeutrAvidin. The purified cell surface (Surface) and 10% of the total fraction (Total) were immunoblotted with α4 antibodies (top). Surface and total fractions were also blotted with actin to ensure the integrity of the cell surface assay. The amount of α4 subunit on the cell surface was then measured for each condition and normalized to the amount observed in vehicle-treated samples (lower panel) (dashed line represents vehicle set at 100%, p < 0.05). B, COS-7 cells co-transfected with either wild-type (α4-WT) or S443A mutant (α4-S443A) GABAA receptor α4 and β3 subunits were treated with either vehicle or PDBu (500 nm for 10 min) and then subjected to biotinylation. Histograms show the proportion of cell surface α4 protein expressed as a percentage of vehicle-treated controls (dashed line represents vehicle set at 100%; p < 0.05). Error bars, S.E.
FIGURE 4.
FIGURE 4.
Analyzing PKC phosphorylation of GABAAR subunits that mediate tonic inhibition. A, COS-7 cells expressing the α4 and β3 subunits were treated with 500 nm PDBu for 10 min and then immunoblotted with phospho-S408A/S409A (pS408/9) or β3 antibodies, and the ratio of pS408/9/β3 immunoreactivity was determined and normalized to control (dashed line represents vehicle set at 100%; p < 0.05). B, COS-7 cells expressing α4, β3, and δ subunits were labeled with 0.5 mCi/ml [32P]orthophosphoric acid and treated with 500 nm PDBu for 10 min. The δ subunit was isolated by denaturing immunoprecipitation followed by SDS-PAGE (IP/32P). Parallel cultures were immunoprecipitated and immunoblotted with δ antibodies (IP/WB δ).
FIGURE 5.
FIGURE 5.
The RFP-BBSα4 subunit forms a functional channel when expressed with the β3 subunit. Examples of GABA-mediated currents recorded from HEK293 cells expressing wild-type α4β3 and RFP-BBSα4β3 GABAARs. A solid line above the trace represents the application of either 1 mm (black line) or 1 μm (gray line) GABA.
FIGURE 6.
FIGURE 6.
S443A point mutation increases the rate of insertion of the α4 subunit into the cell membrane. A, α4-WT and α4-S443A DNA constructs were made containing an RFP tag as well as a BBS. COS-7 cells were then co-transfected with either wild-type (α4-WT-BBS) or S443A mutant (α4-S443A-BBS) and β3 GABAA receptor subunits. Transfected COS7 cells were then incubated with unlabeled Bgt (10 nm for 10 min) at 12 °C to block insertion. Cells were then incubated with Alexa 647-conjugated Bgt (10 nm for 10 min) at 37 °C. Cells were then fixed, and the level of newly inserted Alexa 647-tagged α4 was determined using confocal microscopy and quantified using MetaMorph. B, the graph is presented as a ratio of Alexa 647 fluorescent intensity (newly inserted protein) to RFP fluorescence (total protein) over specific time periods. Ratios for α4-WT and α4-S443A were then compared with one another (p < 0.05). Error bars, S.E.
FIGURE 7.
FIGURE 7.
S443A point mutation reduces turnover of the α4 subunit in transfected COS-7 cells. Untransfected COS-7 cells (UT) or COS-7 transfected with either wild-type (α4-WT) or S443A mutant (α4-S443A) GABAA receptor subunits subjected to a pulse-chase with [35S]methionine. Cells were lysed and immunoprecipitated with anti-α4 subunit antibody and then subjected to SDS-PAGE. Bands were then analyzed by autoradiography (top). Turnover levels are presented as a percentage of levels at time 0 (bottom) (p < 0.05). Error bars, S.E.
FIGURE 8.
FIGURE 8.
Run-down of GABAA receptor α4β3-mediated responses are prevented with protein kinase C activation. A, 1 μm GABA-activated currents recorded at 0, 10, and 20 min after the start of the experiment (defined as t = 0 min and 100%), recorded 3–5 min after achieving the whole-cell configuration. Whole-cell currents were recorded from HEK293 cells expressing α4 and β3 subunits in the absence (control, upper currents) and presence (+[PDBu]i; lower currents) of 100 nm internal PDBu. Holding potential was −60 mV at 32 °C. B, time dependence relationship for 1 μm GABA-activated currents recorded from α4β3 receptors without (open squares) or with (solid squares) 100 nm PDBu internally perfused or with 100 nm PDBU externally perfused (solid diamonds). All data points are mean ± S.E. (error bars).
FIGURE 9.
FIGURE 9.
Inclusion of the inactive phorbol ester, 4-α-Phorbol 12,13-didecanoate, does not prevent run-down of GABAA receptor α4β3-mediated responses. A, overlaid GABA-evoked currents from HEK293 cells expressing α4β3 receptors recorded at t = 0 (gray) and t = 16 (black) min after the start of the experiment. Significant run-down of current amplitude at t = 16 compared with t = 0 is observed in control and in the presence of 4-α-phorbol 12,13-didecanoate (4α-phorbol). In comparison, the current at t = 16 min in the presence of internal 100 nm PDBU was not different from that at t = 0 min. B, bar graph of the relative current at t = 16 min compared with current at t = 0 min for cells in control conditions (n = 8), perfused internally with 100 nm PDBU (n = 3) or 100 nm 4α-phorbol (n = 3). Values are mean ± S.E. (error bars).
FIGURE 10.
FIGURE 10.
Run-down is prevented with the inclusion of the α4S443A mutation. A, whole-cell currents recorded from HEK293 cells expressing α4S443A β3 receptors. 3–5 min after achieving the whole cell configuration (defined as t = 0 and 100%), mediated by 1 μm GABA were recorded at 0, 10, and 20 min after the start of the experiment and recorded. Current was recorded in the absence (control, upper currents) and presence of 100 nm PDBu (lower currents). B, time dependence relationship for 1 μm GABA-activated currents recorded from α4β3 receptors without (open squares) or with (solid squares) 100 nm PDBu internally perfused. All data points are mean ± S.E. (error bars).
FIGURE 11.
FIGURE 11.
PKC increases the level of phosphorylation and cell surface expression of the α4 subunit in hippocampal slices. A, hippocampal slices from 10–11-week-old C57BL/6 male mice were labeled with [32P]orthophosphoric acid and treated with either vehicle or PDBu (500 nm for 10 min). Detergent-soluble extracts were immunoprecipitated with either rabbit IgG or anti-α4, resolved by SDS-PAGE, and then visualized by phosphorimaging (top). Histograms are presented as 32P incorporation expressed as a percentage of vehicle-treated control (bottom) (dashed line, p < 0.05). B, the immunoprecipitated α4 subunit from [32P]orthophosphoric acid-treated hippocampal slices was subjected to phosphoamino acid analysis followed by autoradiography. The migration of phosphoserine (pS), phosphothreonine (pT), and phosphotyrosine (pY) standards is indicated. C, hippocampal slices from 10–11-week-old C57BL/6 male mice treated with either vehicle or PDBu (500 nm for 10 min) were labeled with NHS-SS-biotin and detergent-soluble extracts were purified on NeutrAvidin. Cell surface (Surface) and 10% of total fractions (Total) were analyzed by immunoblotting with anti-α4 (top). Histograms show the proportion of cell surface α4 protein expressed as a percentage of vehicle-treated controls (bottom) (dashed line, vehicle set at 100%; p < 0.05). Error bars, S.E.

References

    1. Farrant M., Nusser Z. (2005) Nat. Rev. Neurosci. 6, 215–229 - PubMed
    1. Rudolph U., Crestani F., Möhler H. (2001) Trends Pharmacol. Sci. 22, 188–194 - PubMed
    1. Sieghart W., Sperk G. (2002) Curr. Top. Med. Chem. 2, 795–816 - PubMed
    1. Mody I. (2005) J. Physiol. 562, 37–46 - PMC - PubMed
    1. Brünig I., Scotti E., Sidler C., Fritschy J. M. (2002) J. Comp. Neurol. 443, 43–55 - PubMed

Publication types