. 2011 Mar;89(3):329-42.
doi: 10.1189/jlb.0710386. Epub 2010 Oct 12.

Pivotal advance: The promotion of soluble DC-SIGN release by inflammatory signals and its enhancement of cytomegalovirus-mediated cis-infection of myeloid dendritic cells

Affiliations

Pivotal advance: The promotion of soluble DC-SIGN release by inflammatory signals and its enhancement of cytomegalovirus-mediated cis-infection of myeloid dendritic cells

N Plazolles et al. J Leukoc Biol. 2011 Mar.

Abstract

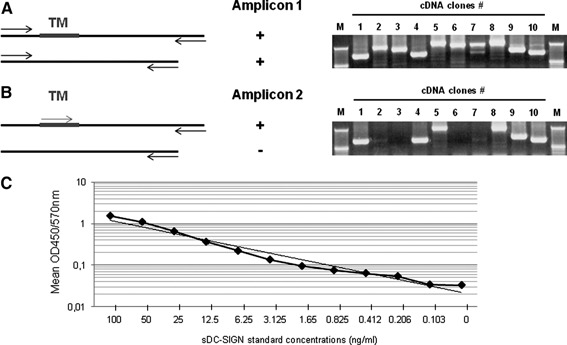
DC-SIGN is a member of the C-type lectin family. Mainly expressed by myeloid DCs, it is involved in the capture and internalization of pathogens, including human CMV. Several transcripts have been identified, some of which code for putative soluble proteins. However, little is known about the regulation and the functional properties of such putative sDC-SIGN variants. To better understand how sDC-SIGN could be involved in CMV infection, we set out to characterize biochemical and functional properties of rDC-SIGN as well as naturally occurring sDC-SIGN. We first developed a specific, quantitative ELISA and then used it to detect the presence sDC-SIGN in in vitro-generated DC culture supernatants as cell-free secreted tetramers. Next, in correlation with their inflammatory status, we demonstrated the presence of sDC-SIGN in several human body fluids, including serum, joint fluids, and BALs. CMV infection of human tissues was also shown to promote sDC-SIGN release. Based on the analysis of the cytokine/chemokine content of sDC-SIGN culture supernatants, we identified IFN-γ and CXCL8/IL-8 as inducers of sDC-SIGN production by MoDC. Finally, we demonstrated that sDC-SIGN was able to interact with CMV gB under native conditions, leading to a significant increase in MoDC CMV infection. Overall, our results confirm that sDC-SIGN, like its well-known, counterpart mDC-SIGN, may play a pivotal role in CMV-mediated pathogenesis.


Figures

Figure 1
Figure 1
Cloning expression and sDC‐SIGN ELISA development. (A) Schematic representation of the full‐length DC‐SIGN‐encoding cDNA amplification by RT‐PCR. The DC‐SIGN_SM/DC‐SIGN_AS primer pair was used here to amplify all DC‐SIGN sequences denoted by the “+” sign under “Amplicon 1” (product size range from 1041 to 633 bp). Amplicons were separated on an agarose gel (1%), and DNA was labeled with ethidium bromide. (B) The legend here is identical to the previous one except for the primer pair used to amplify only TM‐containing cDNA DC‐SIGN‐encoding sequences (DC‐SIGN_SS/DC‐SIGN_AS). A ″–″ sign indicated under “Amplicon 2” means that no amplicon could be detected on the gel. M, molecular weight marker. (C) Standard curve of FLAG‐sDC‐SIGN1AT1 titration. Data was plotted as OD450 nm (with a 570‐nm reference filter) on the y‐axis against sDC‐SIGN concentrations (ng/ml) on the x‐axis. OD values are representative of four distinct experiments.
Figure 2
Figure 2
sDC‐SIGN is released by DCs in the course of their differentiation. Culture supernatants from (A) MoDC or (B) CD34+ hematopoietic stem cells were tested for the presence of sDC‐SIGN by ELISA. (A and B) Asterisks indicate addition of exogenous IL‐4 to culture media. (C) Western blot analysis of cell lysates (Lanes 1–5) and (D) 10× concentrated culture supernatants (Lanes 1′–5′) obtained from MoDC generated with IL‐4/GM‐CSF (Lanes 1 and 1′), IFN‐α/GM‐CSF (Lanes 2 and 2′), IL‐13/GM‐CSF (Lanes 3 and 3′), IL‐4 (Lanes 4 and 4′), or IL‐13 (Lanes 5 and 5′). The biotin‐conjugated 3E1 mAb clone (anti‐DC‐SIGN) was used as the detection antibody.
Figure 3
Figure 3
Characterization of the releasing mode and oligomerization status of MoDC‐derived sDC‐SIGN. (A) Dose‐dependent effect of Marimastat™ on mDC‐SIGN (MFI, mean fluorescence intensity: black bars, cytometric analysis) and sDC‐SIGN (ELISA) expression by 6‐day immature MoDC (open bars). (B) ELISA titration of sDC‐SIGN in membrane ghosts (m), 10× concentrated culture supernatant (sn), 10× concentrated ultracentrifuged culture supernatant (snc; 100,000 g, 2 h), and post‐ultracentrifugation pellet of the culture supernatant (p). Total protein (50 μg) was used for sDC‐SIGN titrations for all tested samples (BCA total protein quantification). (C) The oligomerization status analysis of FLAG‐sDC‐SIGN1AT1/T3 was studied by gel filtration. Fractions (500 μl‐sized), each containing 100‐μg purified FLAG‐sDC‐SIGN1AT1 (▪), FLAG‐sDC‐SIGN1AT3 (♦), and CRD alone (approximately 19 kDa; ▴; monomeric control), were separated onto a gel filtration column (GE Healthcare). Elution fractions were collected (1 ml) and analyzed further by ELISA to quantify sDC‐SIGN, except for the CRD. Indeed, CRD was devoid of the neck region recognized by the H‐200‐coating anti‐DC‐SIGN pAb. Thus, CRD was quantified in eluted fractions by BCA. The results are plotted as the sDC‐SIGN concentrations, according to the elution volume. Standard MW are indicated by black arrowheads on the top of the graph and positioned at their corresponding elution volume (thyroglobulin=670,000 kD; bovine γ‐globulin=158,000 kD; chicken OVA=44,000 kD; equine myoglobin=17,000 kD). (D) Five concentrated, FLAG‐sDC‐SIGN1AT1‐associated, peak‐surrounding fractions were analyzed by Western blot. Each fraction is characterized by its elution volume, indicated for each lane on the top of the gel. FLAG‐sDC‐SIGN1AT1 was used as a positive control (200 ng loaded in the “+” lane).
Figure 4
Figure 4
sDC‐SIGN is released in higher amounts in inflammatory human body fluids. (A) sDC‐SIGN was detected in human sera from 21 healthy blood donors by Western blot analysis. Each serum (10 μl) was mixed with 2× loading buffer before migrating on a SDS‐PAGE gel (10% acrylamide) under reducing conditions. After transfer onto a nitrocellulose membrane, sDC‐SIGN was detected by immunoblotting with the mAb 3E1 (anti‐DC‐SIGN). Dashed lines indicate separation among three distinct digitalized gel pictures. (B) sDC‐SIGN was quantified in the serum of 62 healthy volunteers by ELISA. Values are indicated in ng/ml and have been displayed as a box‐and‐whisker plot, done with the GraphPad Prism software (mean serum sDC‐SIGN concentration=65.36 ng/ml; min=0 ng/ml; max=154 ng/ml; median=72 ng/ml; 25th percentile=32.41 ng/ml; 75th percentile=95.75 ng/ml). (C) BAL from patients were collected and analyzed by sDC‐SIGN ELISA. Samples were separated according to their inflammatory status [i.e., (CRP)serum<5 mg/ml=noninflammatory]. Mean sDC‐SIGN values (black bars) were calculated for both groups (n=13): inflammatory = 24.4 ng/ml versus noninflammatory = 1.37 ng/ml. Comparison of mean values was done using a Mann‐Whitney test. The significant difference is indicated by **P = 0.0005. (D) sDC‐SIGN was quantified by ELISA in paired samples of joint fluids (left panel, n=5) and sera (right panel, n=6) and from RA versus osteoarthritis‐suffering patients. For each type of biological fluid, comparison between the two groups was performed with a Mann‐Whitney test. The significant differences are indicated by ** in each panel (joint fluid, P=0.006; serum, P=0.02). (E) Correlation graph displaying sDC‐SIGN concentrations in serum (y‐axis) compared with those measured in joint fluids from the same patients (x‐axis). The correlation coefficient (r2=0.624) and the corresponding P value (P=0.0038) are indicated near the linear regression curve.
Figure 5
Figure 5
CMV infection‐induced inflammation of mucosal explants promotes sDC‐SIGN release. (A) Frozen sections were analyzed by confocal imaging 2 h after sampling (a and d), after a 7‐day subculture in DMEM (b and e), or after infection with CMV (VHL/E strain) and a 7‐day subculture in DMEM (c and f). Nuclei were counterstained with DAPI (blue), and IE/E CMV Ag (a–c) or DC‐SIGN (d–f) was stained with primary, specific antibodies, followed by incubation with Alexa 488‐conjugated goat anti‐mouse mAb. (c) The inset represents a high magnification picture of an IE/E Ag‐positive nucleus. The interface between the mucosa and the lamina propria is highlighted by white dashed lines. White arrows indicate the lumen location. (B) CMV‐infected (VHL/E strain) or noninfected mucosal explant culture supernatants were harvested at Day 0 and 7 days post‐infection (pi) and submitted to sDC‐SIGN quantification by ELISA. The results are representative of at least three independent experiments. Statistical significances are represented as P values on the graph and are identical between “Day 0‐no VHL/E” versus “Day7‐no VHL/E” and “Day 0‐no VHL/E” versus “Day 0‐with VHL/E” (ns) on the one hand and between “Day 0‐with VHL/E” versus “Day 7‐with VHL/E” and “Day 7‐no VHL/E” versus “Day 7‐with VHL/E” on the other hand. (C) Inflammation‐associated cytokines and chemokines were quantified by the CBA (BD Biosciences) in CMV‐infected (VHL/E; 600,000 pfu/cm2) or LPS‐treated (100 ng/ml; 24 h) explant culture supernatants, which were harvested at different time‐points post‐treatment: 0.16 (10 min), 0.5 (30 min), 1, 14, 24, or 36 h postinfection. Human IFN‐γ, TNF‐α, CXCL‐8 (IL‐8), CXCL‐10 (IP‐10), IL‐1β, and IL‐6 were quantified simultaneously in each sample after being diluted (1/10 dilution). All of these results were representative of two independent experiments.
Figure 6
Figure 6
sDC‐SIGN secretion by immature, fully differenciated MoDC is positively regulated by CXCL‐8/IL‐8 and IFN‐γ, alone or in combination. IL‐4‐starved MoDC (6 days) were cultured with increasing doses of human rCXCL‐8/IL‐8, rCXCL‐10/IP‐10, rIL‐6 (0.1, 1, 10 ng/ml), or rIFN‐γ (10, 100, 1000 UI/ml). One condition consists of a mix of CXCL‐8/IL‐8 and IFN‐γ at their respective low, intermediate, and high concentrations mentioned above. MoDC supernatants were analyzed after 48 h by ELISA to measure corresponding sDC‐SIGN quantity. All of these results were representative of at least three independent experiments. Statistical significances are represented as P values.
Figure 7
Figure 7
sDC‐SIGN is functional and promotes CMV infection of MoDC. (A) Interaction between CMV gB and FLAG‐sDC‐SIGN1AT1 was assessed by dot blot under native conditions. Lysates of transiently transfected HEK cells were spotted in duplicate onto a nitrocellulose membrane according to the following order (from the top to the bottom of the membrane): mock (empty pRC/CMV vector)‐, CMV gB (respectively, with 5, 2.5, and 1.25 μg gB‐encoding plasmid, pRC/CMV‐CMVgB)‐, and FLAG‐sDC‐SIGN1AT1‐expressing cells (respectively, transfected with 5 and 0.5 μg pCDNA3.1‐FLAG‐sDCSIGN1AT1 vector). CMV gB was selectively detected with a first incubation with a FLAG‐sDC‐SIGN1AT1 solution (5 μg/ml in TBS, 0.05% Tween, 5% creamed milk), followed by a HRP‐conjugated anti‐FLAG mAb (clone M2; 1/10,000) at room temperature. Control detections were made using only the HRP‐conjugated anti‐FLAG mAb or alternatively, mAb directed against DC‐SIGN (clone 3E1, biotinylated), CMV gB (clone HCMV37), or F‐actin, respectively, revealed by a HRP‐conjugated streptavidin or goat anti‐mouse IgG. (B) A single dose of TBGFP (MOI=20) was preincubated with or without increasing amounts of FLAG‐sDC‐SIGN1AT1 (final concentrations: 400, 200, 100, 50, 25, and 12.5 ng/ml) for 30 min (4°C), prior to being added to MoDC for a further 2‐h incubation at 37°C. Cells were analyzed after 24 h by flow cytometry to determine the percentage of GFP‐positive cells (i.e., early infected cells). These experiments were performed with MoDC obtained from four distinct, healthy blood donors. (C) The same experiments were performed with MoDC (a single donor; upper panels) or FSF (lower panels) in the presence or absence of a preadsoption step on a mannan‐conjugated agarose matrix. GFP+ cells (i.e., CMV‐infected cells) are indicated for each panel inside the gate containing positive cells. These results are representative of two independent experiments performed with MoDC from distinct donors. SSC, Side‐scatter.

Comment in

References

    1. Geijtenbeek, T. B. , Kwon, D. S. , Torensma, R. , van Vliet, S. J. , van Duijnhoven, G. C. , Middel, J. , Cornelissen, I. L. , Nottet, H. S. , KewalRamani, V. N. , Littman, D. R. , Figdor, C. G. , van Kooyk, Y. (2000) DC‐SIGN, a dendritic cell‐specific HIV‐1‐binding protein that enhances trans‐infection of T cells. Cell 100, 587–597. - PubMed
    1. Lai, W. K. , Sun, P. J. , Zhang, J. , Jennings, A. , Lalor, P. F. , Hubscher, S. , McKeating, J. A. , Adams, D. H. (2006) Expression of DC‐SIGN and DC‐SIGNR on human sinusoidal endothelium: a role for capturing hepatitis C virus particles. Am. J. Pathol. 169, 200–208. - PMC - PubMed
    1. Tailleux, L. , Pham‐Thi, N. , Bergeron‐Lafaurie, A. , Herrmann, J‐L. , Charles, P. , Schwartz, O. , Scheinmann, P. , Lagrange, P. H. , de Blic, J. , Tazi, A. , Gicquel, B. , Neyrolles, O. (2005) DC‐SIGN induction in alveolar macrophages defines privileged target host cells for mycobacteria in patients with tuberculosis. PLoS Med. 2, e381. - PMC - PubMed
    1. Van Lent, P. L. E. M. , Figdor, C. G. , Barrera, P. , van Ginkel, K. , Slöetjes, A. , van den Berg, W. B. , Torensma, R. (2003) Expression of the dendritic cell‐associated C‐type lectin DC‐SIGN by inflammatory matrix metallopro‐teinase‐producing macrophages in rheumatoid arthritis synovium and interaction with intercellular adhesion molecule 3‐positive T cells. Arthritis Rheum. 48, 360–369. - PubMed
    1. Feinberg, H. , Guo, Y. , Mitchell, D. A. , Drickamer, K. , Weis, W. I. (2005) Extended neck regions stabilize tetramers of the receptors DC‐SIGN and DC‐SIGNR. J. Biol. Chem. 280, 1327–1335. - PubMed

Publication types

MeSH terms