

Method of LDL cholesterol measurement influences classification of LDL cholesterol treatment goals: clinical research study
- PMID: 20940623
- PMCID: PMC3992945
- DOI: 10.231/JIM.0b013e3181fb7ca7
Method of LDL cholesterol measurement influences classification of LDL cholesterol treatment goals: clinical research study
Abstract
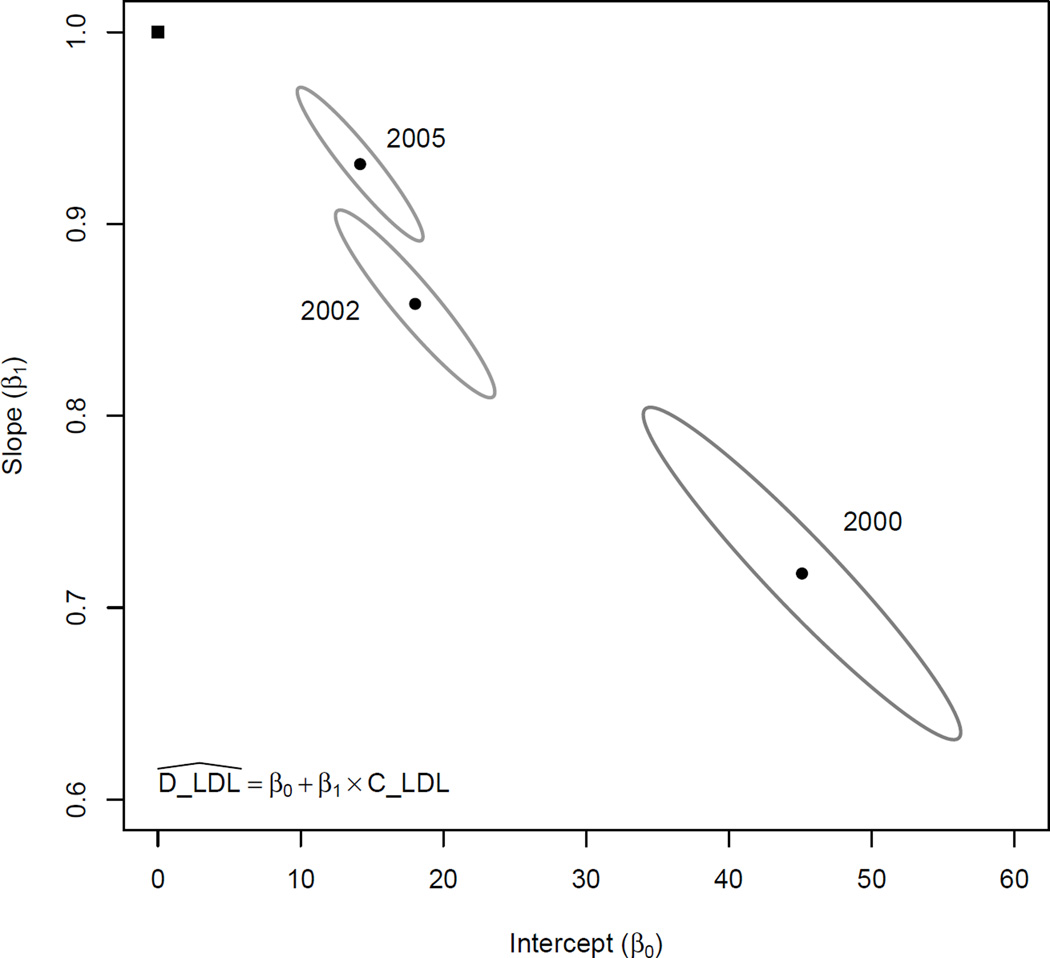
Background: Low-density lipoprotein cholesterol (LDL-C) has been clearly associated with the risk of developing coronary heart disease. The best and most convenient method for determining LDL-C has come under increased scrutiny in recent years. We present comparisons of the Friedewald calculated LDL-C (C-LDL-C) and direct LDL-C (D-LDL-C) using 3 different homogenous assays. This highlights differences between the 2 methods of LDL-C measurement and how this affects the classification of samples into different LDL-C treatment goals as determined by the National Cholesterol Education Program Adult Treatment Panel III guidelines thus potentially affecting treatment strategies.
Methods: Lipid profiles of a total of 2208 clinic patients were retrieved from the Central Arkansas VA Healthcare System clinical laboratory database. Samples studied were of 1-week period during the 3 periods studied: 2000 (period 1), 2002 (period 2), and 2005 (period 3). Different homogenous assays for D-LDL-C measurement were used for each of the 3 periods.
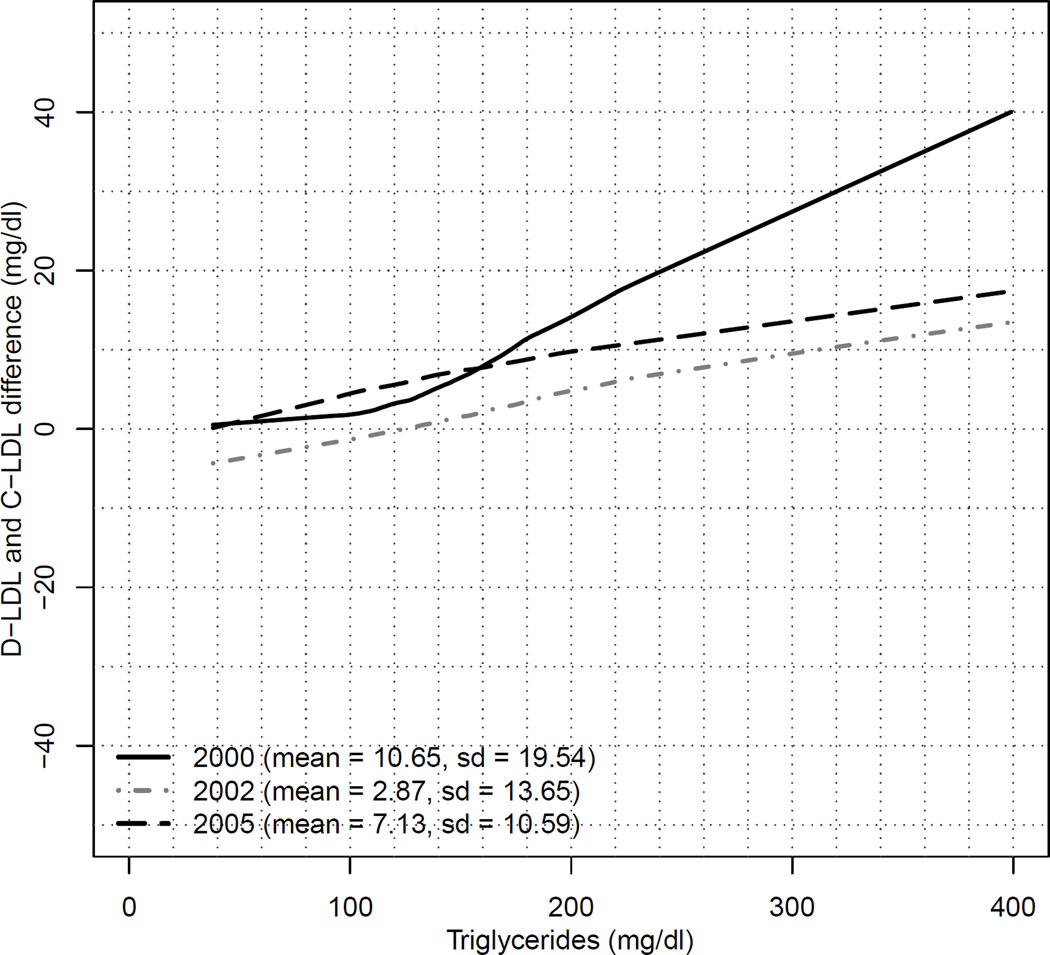
Results: There is a fundamental disagreement between D-LDL-C and C-LDL-C, although Pearson correlation coefficients are 0.93, 0.97, and 0.98 for periods 1, 2, and 3, respectively. Using the model for period 1, when C-LDL-C is 70 mg/dL, the predicted D-LDL-C is 95 mg/dL (36% higher). The differences between C-LDL-C and predicted D-LDL-C progressively decrease at higher LDL-C cut points. In the assay used in period 3, there are 290 samples with D-LDL-C values between 100 and 130 mg/dL. Of these, only 182 samples show agreement with C-LDL-C values, whereas 90 samples with a D-LDL-C in the 100- to 130-mg/dL range are in the 70- to 100-mg/dL range using the C-LDL-C assay. Although the κ statistics suggests the LDL-C measures have relatively high levels of agreement, the significant generalized McNemar tests (P < 0.01) provide additional evidence of disagreement between C-LDL-C and D-LDL-C during all the 3 periods.
Conclusions: Our results highlight D-LDL-C measurements using 3 different assays during 3 different periods. In all assays, there is a substantial lack of agreement between D-LDL-C and C-LDL-C, which, in most cases, resulted in higher D-LDL-C values than C-LDL-C. This leads to clinically significant misclassification of patient's LDL-C to a different LDL-C treatment goal, which would potentially result in more drug usage, thus exposing patients to more potential adverse effects and at a much greater cost with little evidence of benefit.
Figures
References
-
- Heart Protection Study Collaborative Group. MRC/BHF heart protection study of cholesterol lowering with simvastatin in 20,536 high-risk individuals: A randomized placebo-controlled trial. Lancet. 2002;360(9326):7–22. - PubMed
-
- Wilson PW, D'Agostino RB, Levy D, Belanger AM, Silbershatz H, Kannel WB. Prediction of coronary heart disease using risk factor categories. Circulation. 1998;97(18):1837–1847. - PubMed
-
- Expert Panel on Detection, Evaluation, and Treatment of High Blood Cholesterol in Adults. Executive summary of the third report of the national cholesterol education program (NCEP) expert panel on detection, evaluation, and treatment of high blood cholesterol in adults (adult treatment panel III) JAMA. 2001;285(19):2486–2497. - PubMed
-
- Esteban-Salan M, Aguilar-Doreste JA, Arranz-Pena ML, et al. Multicentric evaluation of the homogeneous LDL-cholesterol plus assay: Comparison with beta-quantification and friedewald formula. Clin Biochem. 2008;41(16–17):1402–1409. - PubMed
-
- Miller WG, Waymack PP, Anderson FP, et al. Performance of four homogeneous direct methods for LDL-cholesterol. Clin Chem. 2002;48(3):489–498. - PubMed
Publication types
MeSH terms
Substances
Grants and funding
LinkOut - more resources
Full Text Sources
Medical
