Comparative Study
. 2011 Mar;31(3):832-41.
doi: 10.1038/jcbfm.2010.173. Epub 2010 Oct 13.

Striatal and cortical BOLD, blood flow, blood volume, oxygen consumption, and glucose consumption changes in noxious forepaw electrical stimulation

Affiliations
Comparative Study

Striatal and cortical BOLD, blood flow, blood volume, oxygen consumption, and glucose consumption changes in noxious forepaw electrical stimulation

Yen-Yu I Shih et al. J Cereb Blood Flow Metab. 2011 Mar.

Abstract

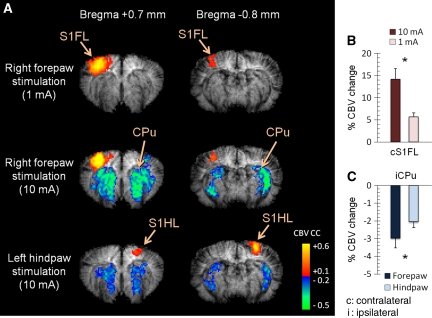
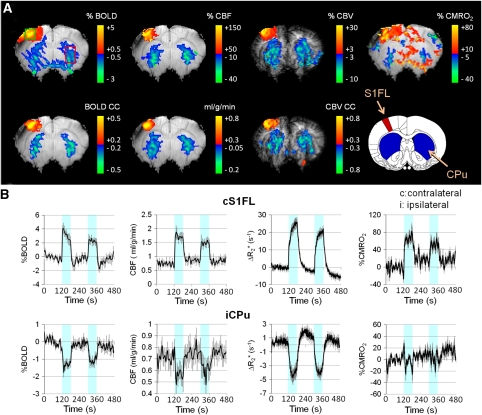
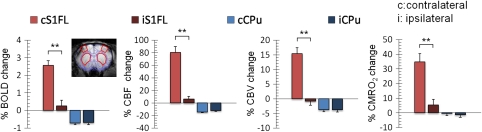
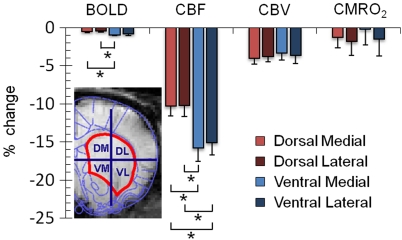
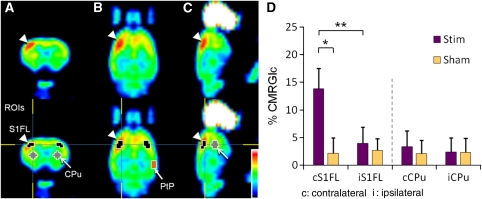
Recent reports showed noxious forepaw stimulation in rats evoked an unexpected sustained decrease in cerebral blood volume (CBV) in the bilateral striatum, whereas increases in spike activity and Fos-immunoreactive cells were observed. This study aimed to further evaluate the hemodynamic and metabolic needs in this model and the sources of negative functional magnetic resonance imaging (fMRI) signals by measuring blood oxygenation-level-dependent (BOLD), cerebral-blood-flow (CBF), CBV, and oxygen-consumption (i.e., cerebral metabolic rate of oxygen (CMRO(2))) changes using an 11.7-T MRI scanner, and glucose-consumption (i.e., cerebral metabolic rate of glucose (CMRglc)) changes using micro-positron emission tomography. In the contralateral somatosensory cortex, BOLD, CBF, CBV, CMRO(2) (n=7, P<0.05), and CMRglc (n=5, P<0.05) increased. In contrast, in the bilateral striatum, BOLD, CBF, and CBV decreased (P<0.05), CMRO(2) decreased slightly, although not significantly from baseline, and CMRglc was not statistically significant from baseline (P>0.05). These multimodal functional imaging findings corroborate the unexpected negative hemodynamic changes in the striatum during noxious forepaw stimulation, and support the hypothesis that striatal hemodynamic response is dominated by neurotransmitter-mediated vasoconstriction, overriding the stimulus-evoked fMRI signal increases commonly accompany elevated neuronal activity. Multimodal functional imaging approach offers a means to probe the unique attributes of the striatum, providing novel insights into the neurovascular coupling in the striatum. These findings may have strong implications in fMRI studies of pain.


Figures

Figure 1
Figure 1
Effect of innocuous forepaw, noxious forepaw, and noxious hindpaw electrical stimulation. (A) CBV-weighted fMRI of the two imaging slices from a representative animal. Contralateral activation of the sensory cortices can be consistently observed, but striatal vasoconstriction can be detected only under noxious stimulation. (B) Group-averaged percent-CBV changes of innocuous and noxious stimulation in the contralateral S1FL (see Figure 2 for ROIs; n=5). Significant stronger vasodilation was observed with 10-mA stimulation. (C) Group-averaged percent-CBV changes in the ipsilateral striatum under noxious stimulation (n=5). Significant stronger vasoconstriction was observed with noxious forepaw stimulation. Although the magnitude change was significantly different, the spatial distribution of the striatal vasoconstrictive pattern was very similar in noxious right forepaw and noxious left hindpaw stimulation. *P<0.05, significant. Error bars represent s.e.m. values. CBV, cerebral blood volume; fMRI, functional magnetic resonance imaging; ROI, region of interest.
Figure 2
Figure 2
Multiparametric fMRI of noxious forepaw electrical stimulation. (A) BOLD, CBF, CBV, and CMRO2 maps from a representative animal. Increases in BOLD, CBF, CBV, and CMRO2 were predominantly localized in the S1FL, whereas decreases of these fMRI signals were found in the bilateral striatum. It must be noted that only a slight decrease in the striatal CMRO2 was observed. (B) Group-averaged fMRI time courses of the contralateral S1FL and ipsilateral striatum (ROIs shown in the % BOLD map; n=7). The color-shaded regions indicate stimulus ON epochs. Error bars represent s.e.m. values. BOLD, blood oxygen-level dependent; CBF, cerebral blood flow; CBV, cerebral blood volume; CMRO2, cerebral metabolic rate of oxygen; fMRI, functional magnetic resonance imaging; ROI, region of interest.
Figure 3
Figure 3
Group-averaged percent-BOLD, CBF, CBV, and CMRO2 changes in the S1FL and the striatum of both hemispheres (n=7). The ROIs (inset) were defined by anatomy to avoid bias to a particular activation map. Clear lateralization of the stimulus-evoked response was found in the S1FL, but not in the striatum in all four fMRI modalities. **P<0.01, significant. Error bars represent s.e.m. values. BOLD, blood oxygen-level dependent; CBF, cerebral blood flow; CBV, cerebral blood volume; CMRO2, cerebral metabolic rate of oxygen; fMRI, functional magnetic resonance imaging; ROI, region of interest.
Figure 4
Figure 4
Group-averaged percent-BOLD, CBF, CBV, and CMRO2 changes in dorsal medial, dorsal lateral, ventral medial, and ventral lateral areas of the ipsilateral striatum (ROIs see insets; n=7). *P<0.05, significant. Error bars represent s.e.m. values. BOLD, blood oxygen-level dependent; CBF, cerebral blood flow; CBV, cerebral blood volume; CMRO2, cerebral metabolic rate of oxygen; ROI, region of interest.
Figure 5
Figure 5
18F-FDG PET maps of noxious forepaw electrical stimulation in (A) coronal, (B) transverse, and (C) sagittal views from a representative animal. Clear contralateral activation was observed in the S1FL. (D) Relative glucose metabolic changes of noxious forepaw electrical stimulation (n=5 for each group). Percent CMRglc was computed by normalizing the PET signal intensities to that in the posterior parietal cortex (PtP). Significant increase in CMRglc was observed in the contralateral S1FL. The ipsilateral S1FL which served as a control of the image analysis, showed no response. No significant change was detected in the striatum. *P<0.05, **P<0.01. Error bars represent s.e.m. values. CMRglc, cerebral metabolic rate of glucose; 18F-FDG-PET, 18F-fluorodeoxyglucose positron emission tomography.

References

    1. Brown LL. Somatotopic organization in rat striatum: evidence for a combinational map. Proc Natl Acad Sci USA. 1992;89:7403–7407. - PMC - PubMed
    1. Buxton RB. Interpreting oxygenation-based neuroimaging signals: the importance and the challenge of understanding brain oxygen metabolism. Front Neuroenerg. 2010;2:1–16. - PMC - PubMed
    1. Chen CC, Shih YY, Mo KC, Yao NW, Lin ZJ, Huang CH, Shyu BC, Chang C. Mapping dopaminergic denervation in Parkinson disease in vivo and in situ: the visualization of structural details by CBV-weighted fMRI. J Cereb Blood Flow Metab. 2009;29:S607–S608.
    1. Choi JK, Chen YI, Hamel E, Jenkins BG. Brain hemodynamic changes mediated by dopamine receptors: role of the cerebral microvasculature in dopamine-mediated neurovascular coupling. NeuroImage. 2006;30:700–712. - PubMed
    1. Choi JK, Mandeville JB, Chen YI, Grundt P, Sarkar SK, Newman AH, Jenkins BG. Imaging brain regional and cortical laminar effects of selective D3 agonists and antagonists. Psychopharmacology. 2010;212:59–72. - PMC - PubMed

Publication types

MeSH terms