

Statistical analysis strategies for association studies involving rare variants
- PMID: 20940738
- PMCID: PMC3743540
- DOI: 10.1038/nrg2867
Statistical analysis strategies for association studies involving rare variants
Abstract
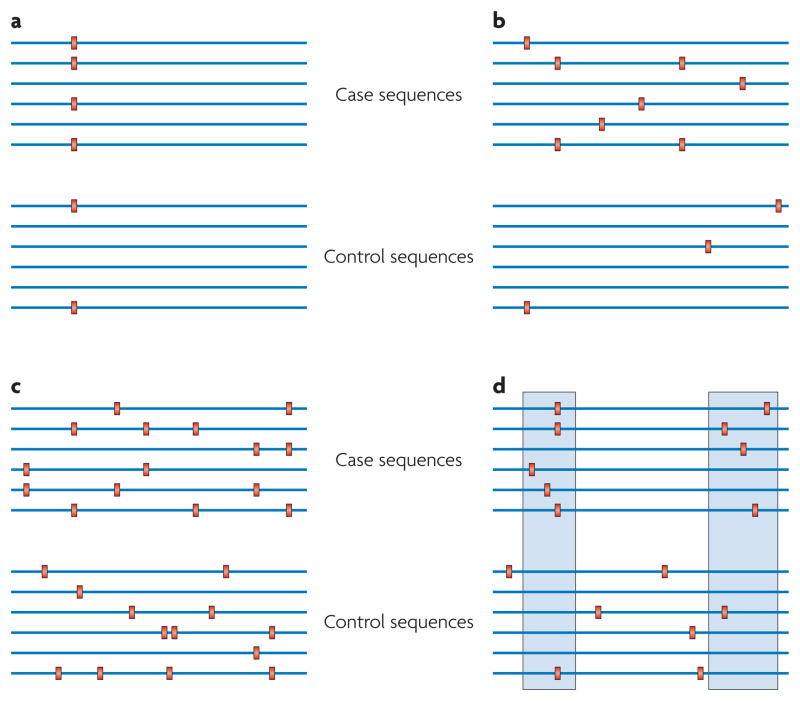
The limitations of genome-wide association (GWA) studies that focus on the phenotypic influence of common genetic variants have motivated human geneticists to consider the contribution of rare variants to phenotypic expression. The increasing availability of high-throughput sequencing technologies has enabled studies of rare variants but these methods will not be sufficient for their success as appropriate analytical methods are also needed. We consider data analysis approaches to testing associations between a phenotype and collections of rare variants in a defined genomic region or set of regions. Ultimately, although a wide variety of analytical approaches exist, more work is needed to refine them and determine their properties and power in different contexts.
Figures

Comment in
-
Tests of association for rare variants: case control mutation screening.Nat Rev Genet. 2011 Mar;12(3):224. doi: 10.1038/nrg2867-c1. Epub 2011 Feb 1. Nat Rev Genet. 2011. PMID: 21283087 Free PMC article. No abstract available.
References
-
- Manolio TA, et al. Finding the missing heritability of complex diseases. Nature. 2009;461:747–53. This paper describes the motivation for considering alternative approaches to discovering genes that influence common complex diseases. It is essentially argues that current GWAS paradigms focusing on common variants have simple failed to identify the majority of genetic variants that influence particular phenotypes. - PMC - PubMed
-
- Frazer KA, Murray SS, Schork NJ, Topol EJ. Human genetic variation and its contribution to complex traits. Nat Rev Genet. 2009;10:241–51. - PubMed
Publication types
MeSH terms
Grants and funding
- R01 HL089655-02/HL/NHLBI NIH HHS/United States
- U19 AG023122/AG/NIA NIH HHS/United States
- U01 DA024417/DA/NIDA NIH HHS/United States
- P50 MH081755-01/MH/NIMH NIH HHS/United States
- U01 DA024417-01/DA/NIDA NIH HHS/United States
- P50 MH081755/MH/NIMH NIH HHS/United States
- R01 AG030474/AG/NIA NIH HHS/United States
- N01 MH022005/MH/NIMH NIH HHS/United States
- U54 CA143906/CA/NCI NIH HHS/United States
- U19 AG023122-05/AG/NIA NIH HHS/United States
- R01 MH078151/MH/NIMH NIH HHS/United States
- R01 MH078151-03/MH/NIMH NIH HHS/United States
- R01 MH080134-03/MH/NIMH NIH HHS/United States
- UL1 RR025774/RR/NCRR NIH HHS/United States
- R01 HL089655/HL/NHLBI NIH HHS/United States
- R01 AG030474-02/AG/NIA NIH HHS/United States
- R01 MH080134/MH/NIMH NIH HHS/United States
- UL1 RR025774-03/RR/NCRR NIH HHS/United States
- U54 CA143906-01/CA/NCI NIH HHS/United States
LinkOut - more resources
Full Text Sources
Other Literature Sources
