. 2010 Sep 13;18(19):20029-48.
doi: 10.1364/OE.18.020029.

Ultrahigh speed 1050nm swept source/Fourier domain OCT retinal and anterior segment imaging at 100,000 to 400,000 axial scans per second

Affiliations

Ultrahigh speed 1050nm swept source/Fourier domain OCT retinal and anterior segment imaging at 100,000 to 400,000 axial scans per second

Benjamin Potsaid et al. Opt Express. .

Abstract

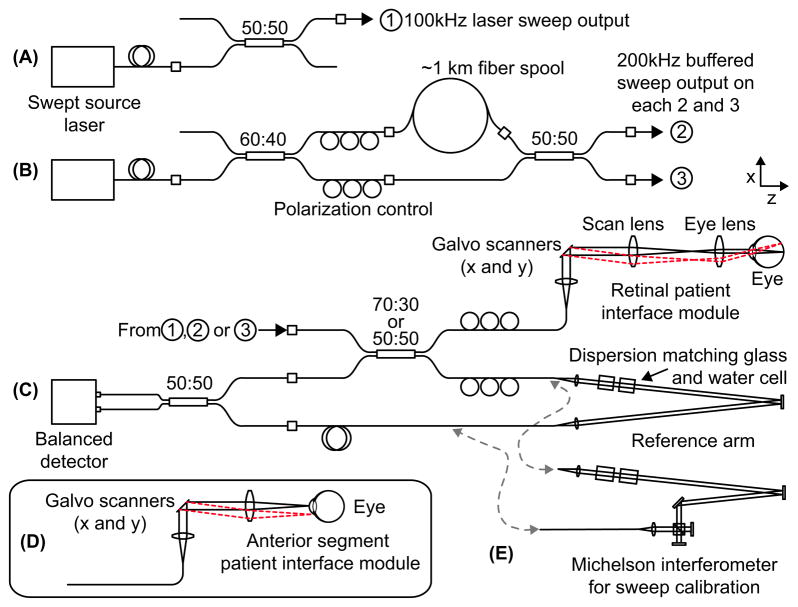
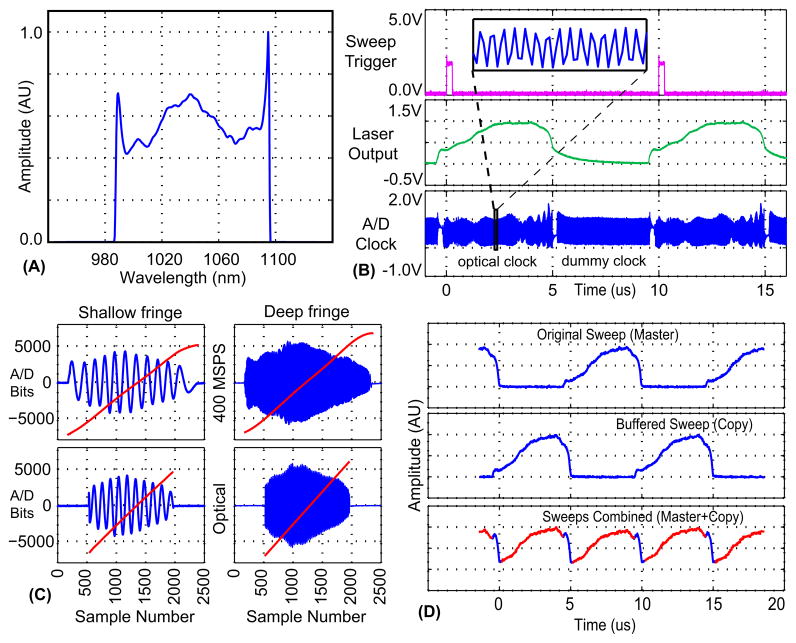
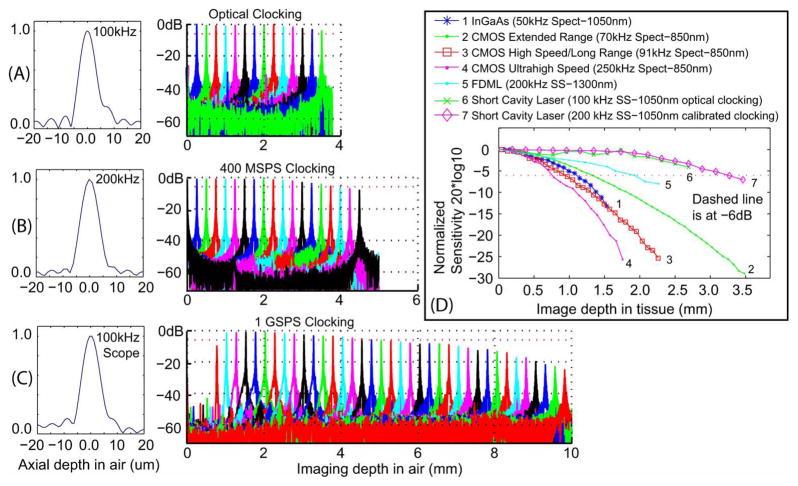
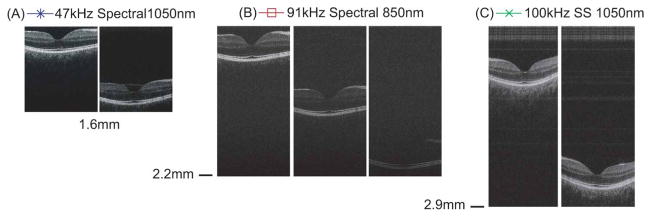
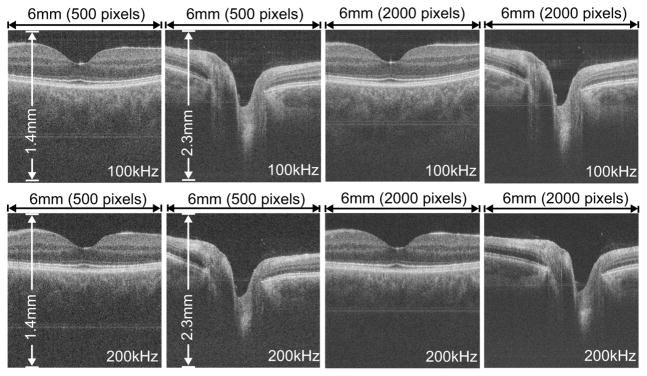
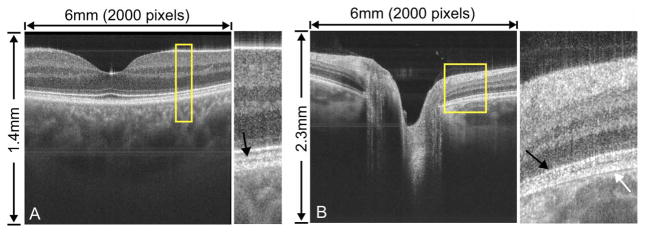
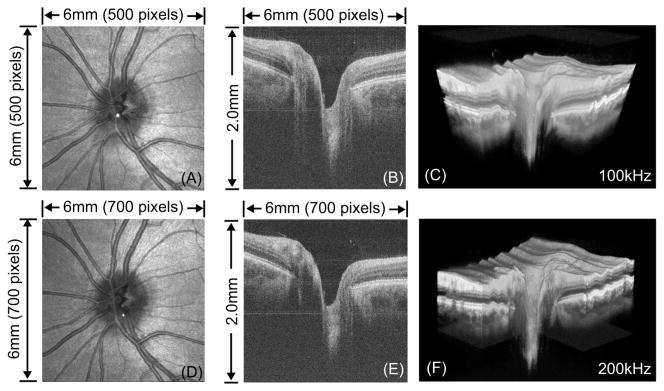
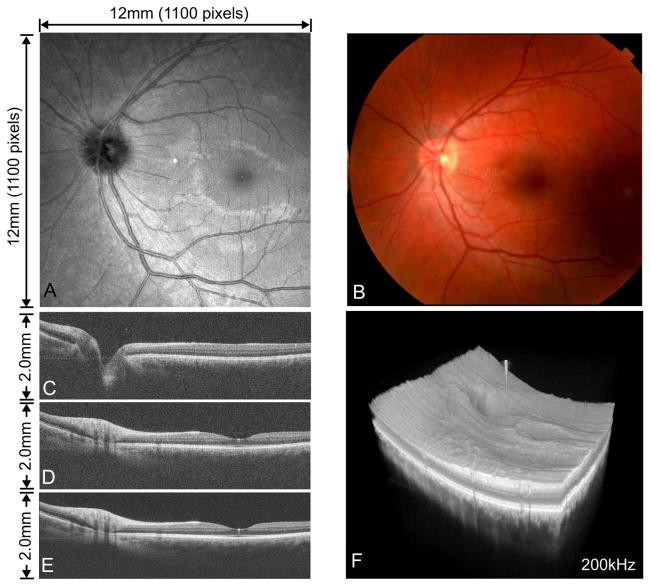
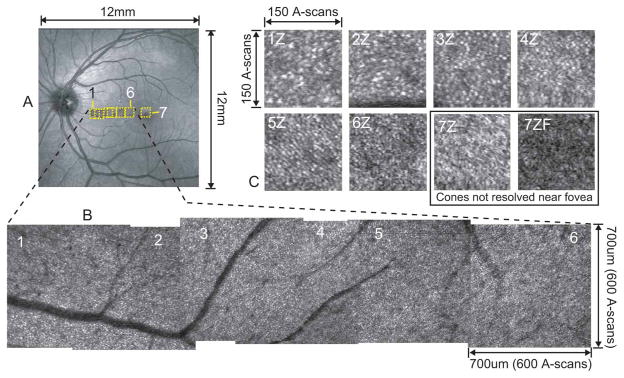
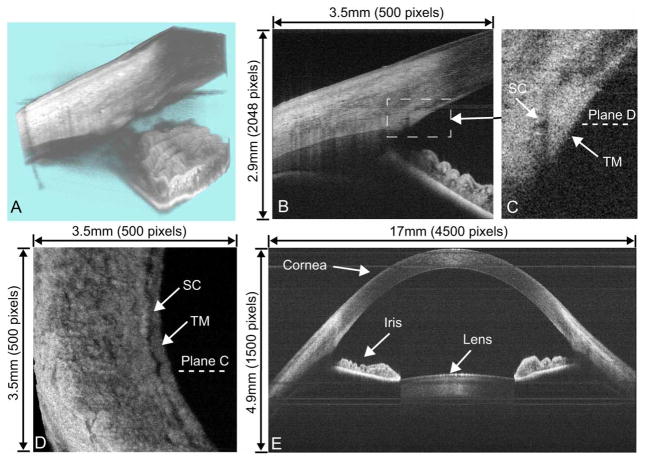
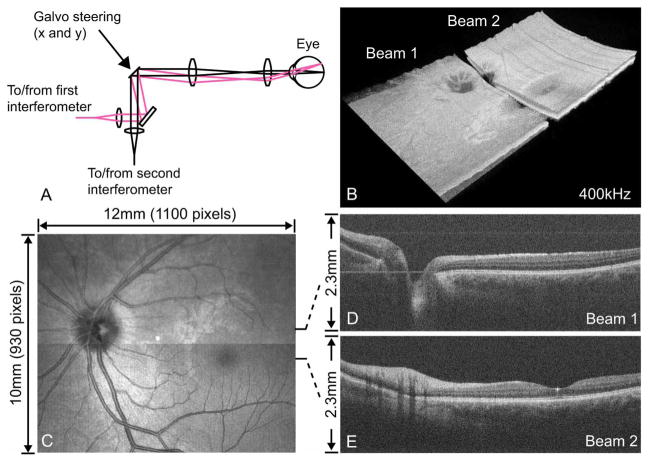
We demonstrate ultrahigh speed swept source/Fourier domain ophthalmic OCT imaging using a short cavity swept laser at 100,000 - 400,000 axial scan rates. Several design configurations illustrate tradeoffs in imaging speed, sensitivity, axial resolution, and imaging depth. Variable rate A/D optical clocking is used to acquire linear-in-k OCT fringe data at 100 kHz axial scan rate with 5.3 um axial resolution in tissue. Fixed rate sampling at 1 GSPS achieves a 7.5mm imaging range in tissue with 6.0 um axial resolution at 100 kHz axial scan rate. A 200 kHz axial scan rate with 5.3 um axial resolution over 4mm imaging range is achieved by buffering the laser sweep. Dual spot OCT using two parallel interferometers achieves 400 kHz axial scan rate, almost 2X faster than previous 1050 nm ophthalmic results and 20X faster than current commercial instruments. Superior sensitivity roll-off performance is shown. Imaging is demonstrated in the human retina and anterior segment. Wide field 12x12 mm data sets include the macula and optic nerve head. Small area, high density imaging shows individual cone photoreceptors. The 7.5 mm imaging range configuration can show the cornea, iris, and anterior lens in a single image. These improvements in imaging speed and depth range provide important advantages for ophthalmic imaging. The ability to rapidly acquire 3D-OCT data over a wide field of view promises to simplify examination protocols. The ability to image fine structures can provide detailed information on focal pathologies. The large imaging range and improved image penetration at 1050 m wavelengths promises to improve performance for instrumentation which images both the retina and anterior eye. These advantages suggest that swept source OCT at 1050 nm wavelengths will play an important role in future ophthalmic instrumentation.


Figures

Fig. 1
Fig. 1
System layout. (A) Swept laser source for 100kHz OCT imaging. (B) Swept laser source for 200kHz and 400kHz OCT imaging. (C) System configuration for retinal imaging. (D) Patient interface for anterior segment imaging. (E) System configuration for sweep calibration.
Fig. 2
Fig. 2
Short cavity light source. (A) Spectrum measured with OSA. (B) Sweep trigger signal, laser output, and A/D clock signal from the swept laser source. (C) OCT fringe data acquired at fixed 400 MSPS clock rate (top) and optically derived, variable frequency A/D clock (bottom) of a shallow fringe (left) and deep fringe (right). The red line indicates the phase of the fringe. (D) Laser sweeps from buffered configuration showing master sweep (top), copy sweep (middle), and combined master and copy sweeps (bottom). The usable portion of the sweep, considering sweep overlap, is indicated in red.
Fig. 3
Fig. 3
Point Spread Function (PSF) and sensitivity roll-off plot comparisons. (A) 100kHz axial scan rate configuration with optical A/D clocking. (B) 200kHz and 400kHz axial scan rate configurations with fixed 400 MSPS internal A/D clocking. (C) 100kHz axial scan rate configuration with digital storage scope acquisition at 1 GSPS. (D) Comparison of sensitivity roll-off performance for different OCT technologies.
Fig. 4
Fig. 4
Depth range and sensitivity roll-off comparison of different OCT technologies demonstrated with retinal imaging of the same eye. Plots of the sensitivity roll-off performance for the different configurations shown are displayed in Fig. 3D, as indicated by the marker symbols.
Fig. 5
Fig. 5
Comparison of cross sectional OCT retinal images acquired at 100kHz and 200kHz axial scan rate of the macula and optic disc. Images are cropped in depth to span 1.4mm for the macula and 2.3mm for the disc.
Fig. 6
Fig. 6
Images of the (A) macula and (B) optic disc consisting of an average of 10 rapidly repeated OCT cross sectional scans acquired at 100kHz axial scan rate. Images are cropped in depth to span 1.4mm for the macula and 2.3mm for the disc.
Fig. 7
Fig. 7
(A) OCT fundus image of 3D volume acquired at 100kHz with 500×500 axial scans over 6mmx6mm (2.6 sec). (B) 100kHz cross sectional image. (C) 3D volume rendering of 100kHz data (Media 1). (C) OCT fundus image of 3D volume acquired at 200kHz with 700×700 axial scans over 6mmx6mm (2.6 sec). (D) 200kHz cross sectional image. (E) 3D volume rendering of 200kHz data. Images are cropped in depth to span 2mm.
Fig. 8
Fig. 8
Large volume data sets acquired at 200kHz axial scan rate in 6.3 seconds consisting of 1100×1100 axial scans over 12mmx12mm. (A) OCT fundus image. (B) Fundus photo. (C) OCT cross sectional image through the disc. (D) OCT cross sectional image through the fovea. (E) Averaged image consisting of 5 adjacent OCT cross sectional images. (F) 3D rendering of volumetric OCT data. Images are cropped in depth to span 2.0mm.
Fig. 9
Fig. 9
Cone imaging at 200kHz axial scan rate. (A) Large area OCT fundus view of retina showing boxes to indicate regions of cone imaging. (B) Cone photoreceptor mosaic formed by merging data from 6 volumes covering 700umx700um square patches consisting of 600×600 axial scans acquired in 2 seconds each. (C) Zoomed in images from volumes 1–7 are cropped to 150×150 axial scans and are shown in 1Z-7ZF. Individual cone photoreceptors can be clearly seen with decreasing size and spacing in the region progressing from the optic disc to the fovea in images 1Z-6Z. The small and closely spaced cones can not be resolved in 7Z, near the fovea, and 7ZF, located at the fovea center.
Fig. 10
Fig. 10
Anterior segment images acquired at 100kHz axial scan rate. (A) 3D OCT volume of the angle consisting of 500×500 axial scans over 3.5×3.5mm acquired in 2.6 seconds using optical clocking (Media 2). (B) Cross sectional image of the angle from (A) consisting of the average of two neighboring cross sectional scans. (C) Zoomed in region from (B) showing Schlemm’s canal (SC) and the trabecular meshwork (TM). (D) OCT en face view extracted from (A) consisting of a depth averaged over 2 en face planes showing coronal section through structures related to outflow (Media 3). (E) OCT cross sectional image of the cornea, iris, and anterior lens acquired using 1 GSPS sampling with an oscilloscope showing high axial resolution imaging over a long imaging range. The image is cropped in depth to span 4.9mm.
Fig. 11
Fig. 11
Dual OCT beam 400kHz axial scan rate imaging results. (A) Dual beam scanning system used in patient interface module. (B) 3D rendering showing the independent volumes that were acquired in parallel. (C) OCT fundus image generated from combining the two volumes acquired in parallel. (D) Example cross sectional OCT image acquired from first channel. (E) Example cross sectional OCT image acquired from second channel. Images are cropped in depth to span 2.3mm. The full data set was acquired in 2.9 seconds.

References

    1. Huang D, Swanson EA, Lin CP, Schuman JS, Stinson WG, Chang W, Hee MR, Flotte T, Gregory K, Puliafito CA, Fujimoto JG. Optical coherence tomography. Science. 1991;254(5035):1178–1181. - PMC - PubMed
    1. Schuman JS, Puliafito CA, Fujimoto JG. Optical Coherence Tomography of Ocular Diseases. Slack, Inc; New Jersey, USA: 2004.
    1. Chinn SR, Swanson EA, Fujimoto JG. Optical coherence tomography using a frequency-tunable optical source. Opt Lett. 1997;22(5):340–342. - PubMed
    1. de Boer JF, Cense B, Park BH, Pierce MC, Tearney GJ, Bouma BE. Improved signal-to-noise ratio in spectral-domain compared with time-domain optical coherence tomography. Opt Lett. 2003;28(21):2067–2069. - PubMed
    1. Leitgeb R, Hitzenberger C, Fercher A. Performance of fourier domain vs. time domain optical coherence tomography. Opt Express. 2003;11(8):889–894. - PubMed

Publication types

MeSH terms