. 2010 Oct 5;1(4):e00176-10.
doi: 10.1128/mBio.00176-10.

Induction of Toll-like receptor 3-mediated immunity during gestation inhibits cortical neurogenesis and causes behavioral disturbances

Affiliations

Induction of Toll-like receptor 3-mediated immunity during gestation inhibits cortical neurogenesis and causes behavioral disturbances

Joari De Miranda et al. mBio. .

Abstract

Maternal infection during pregnancy with a wide range of RNA and DNA viruses is associated with increased risk for schizophrenia and autism in their offspring. A common feature in these exposures is that virus replication induces innate immunity through interaction with Toll-like receptors (TLRs). We employed a mouse model wherein pregnant mice were exposed to polyinosinic-polycytidylic acid [poly(I ⋅ C)], a synthetic, double-stranded RNA molecular mimic of replicating virus. Poly(I ⋅ C) inhibited embryonic neuronal stem cell replication and population of the superficial layers of the neocortex by neurons. Poly(I ⋅ C) also led to impaired neonatal locomotor development and abnormal sensorimotor gating responses in adult offspring. Using Toll-like receptor 3 (TLR3)-deficient mice, we established that these effects were dependent on TLR3. Inhibition of stem cell proliferation was also abrogated by pretreatment with the nonsteroidal anti-inflammatory drug (NSAID) carprofen, a cyclooxygenase (COX) inhibitor. Our findings provide insights into mechanisms by which maternal infection can induce subtle neuropathology and behavioral dysfunction, and they may suggest strategies for reducing the risk of neuropsychiatric disorders subsequent to prenatal exposures to pathogens and other triggers of innate immunity.


Figures
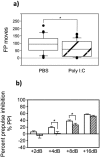
FIG 1
FIG 1
Poly(I ⋅ C) treatment during gestation impairs early locomotor development in neonates and prepulse inhibition (PPI) in adult mice. (a) WT C57BL/6 pregnant mice were treated with either PBS or poly(I ⋅ C) (5 mg/kg) on gestational day 16 (GD16). Protoambulatory behavior of the offspring from pregnant mice treated with PBS or poly(I ⋅ C) was measured in an open-field paradigm. Data are presented as the number of floor plane (FP) moves exhibited by the mice on postnatal day 8. The values for the poly(I ⋅ C)-treated group are significantly different (P < 0.05 by the Mann-Whitney U test) compared to the values for the PBS-treated control group as indicated by the bracket and asterisk. The height of the box plot shows the interquartile range, and the horizontal line indicates the median. The range is indicated by the error bars, and the circles represent outlier values. (b) Sensorimotor gating of the acoustic startle reflex was measured as a percentage of prepulse inhibition in the adult offspring from WT C57BL/6 dams injected on GD16 with either PBS (white bars) or poly(I ⋅ C) (5 mg/kg) (hatched bars). Data are presented as the percent PPI exhibited at each of the four prepulse intensity trials (2, 4, 8, and 16 dB above background noise) by the mice during postnatal weeks 15 to 17. The values for the poly(I ⋅ C)-treated group are significantly different (P < 0.05 by Fisher’s protected least-significant difference [PLSD] test) compared to the values for the PBS-treated control group as indicated by the bracket and asterisk.
FIG 2
FIG 2
Poly(I ⋅ C) treatment during gestation induces defective proliferation in fetal cerebral cortical cells. Pregnant mice were treated with either PBS or poly(I ⋅ C) on 3 consecutive days (GD15 to GD17) and injected with bromodeoxyuridine (BrdU) on GD16. Cerebral cortical cells were isolated from embryos on GD18, and quantitation of BrdU-labeled cells was performed by flow cytometric analysis. (a) Viable cerebral cortical cells were gated according to forward scatter (FSC) and side scatter (SSC) profiles. The percentage of live cells (85.5%) is shown. 50K, 50,000. (b) Representative histogram showing intracellular BrdU incorporation in cerebral cortical cells. The numbers above the brackets indicate the percentages of brightly labeled BrdU cells (BrdUhigh) and a subpopulation of cells that incorporated low levels of BrdU (BrdUlow). Gating for the BrdU-positive cells was based on the anti-BrdU antibody staining observed with cells obtained from mice that were not injected with BrdU (negative control). Anti-BrdU antibody conjugated to allophycocyanin (APC) (BrdU-APC) was used. (c) Representative histogram showing the mean fluorescence intensity (MFI) of BrdU-labeled cells represented as a percentage of maximum BrdU incorporation. Values for the different groups are indicated as follows: PBS-treated mice (red line), poly(I ⋅ C)-treated mice (blue line), and negative-control mice (gray line). The experiments were performed with cerebral cortical cells isolated from embryos (n = 7); data from one representative cortex are shown. (d) Percentage of BrdUhigh cells in cerebral cortical cells from mice treated with PBS or poly(I ⋅ C). Results are expressed as percentages of total gated cells. The values for the poly(I ⋅ C)-treated group are significantly different (P < 0.05 by the Mann-Whitney U test) compared to the values for the PBS-treated control group as indicated by the bracket and asterisk. The height of the box plot shows the interquartile range, and the horizontal line indicates the median. The range is indicated by the error bars, and the circles represent outlier values.
FIG 3
FIG 3
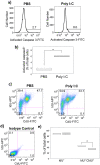
Relative importance of apoptosis and cell cycle arrest to fetal cerebral cortical cell development after poly(I ⋅ C) treatment during gestation. (a) Pregnant mice were treated with either PBS or poly(I ⋅ C) and injected with BrdU on GD16. Cerebral cortical cells were isolated from the embryos on GD18, and quantification of activated caspase 3-positive (caspase 3+) cells was performed by flow cytometric analysis. Representative histograms show intracellular activated caspase 3+ cells in cerebral cortical cells. The numbers above the brackets indicate the percentages of activated caspase 3+ cells. Gating for the caspase 3+ cells was based on the staining observed with the isotype control. Experiments were performed with cerebral cortical cells isolated from embryos (n = 4); data from one representative cortex are shown. (b) Percentage of activated caspase 3+ cells in cerebral cortex from mice treated with PBS or poly(I ⋅ C). The values for the poly(I ⋅ C)-treated group are significantly different (P < 0.05 by the Mann-Whitney U test) compared to the values for the PBS-treated control group as indicated by the bracket and asterisk. (c) Pregnant mice were treated with either PBS or poly(I ⋅ C) and simultaneously injected with 5-iodo-2′-deoxyuridine (IdU) on GD16. After 10 h of IdU exposure, mice received a single injection of 5-chloro-2′-deoxyuridine (CldU). IdU and CldU incorporation was quantified by flow cytometry. Dot plots of IdU+ versus CldU+ cerebral cortical cells from embryos of PBS- or poly(I ⋅ C)-injected dams are shown. (d) Isotype control. The numbers in the four quadrants indicate the percentages of each subpopulation. Gating for the IdU- or CldU-positive cells was based on the staining observed with the isotype control. Experiments were performed with cells isolated from embryos (n = 3 to 4); data from one representative cortex are shown. (e) Percentage of IdU+ and IdU+ CldU+ in cerebral cortical cells from mice treated with PBS or poly(I ⋅ C). Results are expressed as percentages of total viable cells. The values for PBS-treated mice (white bars) and poly(I ⋅ C)-treated mice (hatched bars) are shown. The values for the poly(I ⋅ C)-treated group are significantly different (P < 0.05 by the Mann-Whitney U test) compared to the values for the PBS-treated control group as indicated by the bracket and asterisk. The height of the box plot shows the interquartile range, and the horizontal line indicates the median. The range is indicated by the error bars, and the circles represent outlier values.
FIG 4
FIG 4
Treatment with poly(I ⋅ C) during gestation negatively regulates the transition of PAX6+ radial glia (RG) cells to TBR2+ PAX6+ intermediate progenitor cells (IPC) in a TLR3-dependent manner. WT C57BL/6 or TLR3−/− C57BL/6 pregnant mice were treated with either PBS or poly(I ⋅ C) for three consecutive days (GD15 to GD17) and injected with BrdU on GD16. Cerebral cortical cells were isolated from embryos on GD18. Total viable cells were analyzed for the expression of TBR2 and PAX6 by flow cytometry. (a) Representative histograms showing TBR2+ PAX6+ positive IPC in WT and TLR3−/− cerebral cortical cells isolated from embryos (n = 3) obtained from mice treated with PBS or poly(I ⋅ C). The numbers above the brackets indicate the percentages of TBR2+ PAX6+ IPC. (b) Representative histograms showing PAX6+ RG in WT and TLR3−/− cerebral cortical cells isolated from embryos obtained from PBS- and poly(I ⋅ C)-treated mice. The numbers above the brackets indicate the percentages of PAX6+ RG cells. Gating for the PAX6- or TBR2-positive cells was based on the staining observed with the isotype control. (c) Representative histograms showing the mean fluorescence intensity of TBR2 and PAX6 expression. The mean fluorescence intensity (MFI) is shown as a percentage of the maximum expression. MFI values for the different groups are indicated as follows: PBS-treated group (red line), poly(I ⋅ C)-treated group (blue line), and isotype control group (gray line). The MFI for PBS-treated mice was 1,158.7 ± 57.4, and the MFI for poly(I ⋅ C)-treated mice was 809.3 ± 28.4. (d) Representative histograms showing the MFI of PAX6 expression. Experiments were performed with cerebral cortical cells isolated from embryos (n = 3); data from one representative cortex are shown. MFI values for the different groups are indicated as follows: PBS-treated group (red line), poly(I ⋅ C)-treated group (blue line), and isotype control group (gray line). The MFI for PBS-treated mice was 13,784.0 ± 1,527.3, and the MFI for poly(I ⋅ C)-treated mice was 16,842.3 ± 799.1. (e) Percentages of TBR2+ PAX6+ IPC and PAX6+ RG in WT and TLR3−/− cerebral cortical cells isolated from embryos obtained from PBS- and poly(I ⋅ C)-treated mice. Results are expressed as percentages of total viable cells. The values for PBS-treated mice (white bars) and poly(I ⋅ C)-treated mice (hatched bars) are shown. Values that are significantly different (P < 0.05 by the Mann-Whitney U test) compared to the values for the PBS-treated control group are indicated by the bracket and asterisk. Values that are significantly different (P < 0.05 by the Mann-Whitney U test) compared to the values for the PBS-treated control group are indicated by the bracket and two asterisks. The height of the box plot shows the interquartile range, and the horizontal line indicates the median. The range is indicated by the error bars, and the circles represent outlier values.
FIG 5
FIG 5
Treatment with the nonselective cyclooxygenase (COX) inhibitor carprofen prevents poly(I ⋅ C)-induced decreases in cerebral cortical neurogenesis. WT C57BL/6 pregnant mice were treated with a subcutaneous dose of either carprofen or PBS, followed by intraperitoneal injection of either PBS or poly(I ⋅ C) for three consecutive days (GD15 to GD17). On GD16, the mice were injected with BrdU. Cerebral cortical cells were isolated from pups on postnatal day 8 (PND8), and quantification of BrdU-labeled cells was performed by flow cytometric analysis. Gating for the BrdU-positive cells was based on the anti-BrdU antibody staining observed with cells obtained from mice that were not injected with BrdU (negative control). (a) Representative histograms showing intracellular BrdU incorporation in cerebral cortical cells isolated from pups obtained from the different groups of pregnant mice. The mice were first injected with carprofen or PBS. Two hours later, the mice were injected with PBS or poly(I ⋅ C). The four treatment groups were as follows (the first injection is shown before the slash, and the second injection is shown after the slash): (i) PBS/PBS, (ii) PBS/poly(I ⋅ C), (iii) carprofen/PBS, and (iv) carprofen/poly(I ⋅ C). The numbers above the brackets indicate the percentages of BrdU-labeled cells. (b) Histograms showing the mean fluorescence intensity (MFI) of BrdU-labeled cells represented as a percentage of maximum BrdU incorporation. The treatment groups are as explained above for panel a. The values for the different groups are indicated as follows: PBS/PBS group (red line), carprofen/PBS group (purple line), PBS/poly(I ⋅ C) group (blue line), carprofen/poly(I ⋅ C) group (green line), and negative-control group (gray line). The MFI values for the different groups were as follows: 4,171.0 ± 184.4 for the PBS/PBS group, 3,348.0 ± 204.3 for the carprofen/PBS group, 2,302.3 ± 47.4 for the PBS/poly(I ⋅ C) group, and 3,012.8 ± 102.5 for the carprofen/poly(I ⋅ C) group. Experiments were performed with cerebral cortical cells isolated from pups (n = 4); data from one representative cortex are shown. (c) Percentage of BrdU+ in cerebral cortical cells from pups obtained from pregnant mice pretreated with carprofen or not pretreated with carprofen, followed by treatment with PBS or poly(I ⋅ C). Results are expressed as percentages of total gated cells. The values that are significantly different (P < 0.05 by the Mann-Whitney U test) compared to the values for the PBS-treated control group are indicated by the bracket and asterisk. (d) Representative histograms show intracellular BrdU incorporation in CUX1+ cortical cells isolated from pups obtained from the same treatment groups of pregnant mice as explained above for panel a. The numbers above the brackets indicate the percentages of BrdU+ cells. (e) Representative histogram shows the MFI of BrdU labeling in CUX1+ cerebral cortical cells. Experiments were performed with cerebral cortical cells isolated from pups (n = 4); data from one representative cortex are shown. The values for the different groups are indicated as follows: PBS/PBS group (red line), carprofen/PBS group (purple line), PBS/poly(I ⋅ C) group (blue line), carprofen/poly(I ⋅ C) group (green line), and negative-control group (gray line). The MFI values for the different groups were as follows: 9,180.3 ± 600.5 for the PBS/PBS group, 5,218.5 ± 624.9 for the carprofen/PBS group, 4,453.8 ± 253.6 for the PBS/poly(I ⋅ C) group, and 4,958.5 ± 179.8 for the carprofen/poly(I ⋅ C) group. (f) Percentage of BrdU+ CUX1+ cerebral cortical cells from pups obtained from pregnant mice treated with carprofen or not treated with carprofen, followed by treatment with PBS or poly(I ⋅ C). Results are expressed as percentages of total CUX1+ cells. Values for PBS-treated mice (white bars) and poly(I ⋅ C)-treated mice (hatched bars) are shown. The values for the poly(I ⋅ C)-treated group are significantly different (P < 0.05 by the Mann-Whitney U test) compared to the values for the PBS-treated control group as indicated by the bracket and asterisk. The height of the box plot shows the interquartile range, and the horizontal line indicates the median. The range is indicated by the error bars, and the circles represent outlier values.

Similar articles

Cited by

References

    1. Brown A. S., Vinogradov S., Kremen W. S., Poole J. H., Deicken R. F., Penner J. D., McKeague I. W., Kochetkova A., Kern D., Schaefer C. A. 2009. Prenatal exposure to maternal infection and executive dysfunction in adult schizophrenia. Am. J. Psychiatry 166:683–690 - PMC - PubMed
    1. Patterson P. H. 2007. Neuroscience. Maternal effects on schizophrenia risk. Science 318:576–577 - PubMed
    1. Schmitz C., van Kooten I. A., Hof P. R., van Engeland H., Patterson P. H., Steinbusch H. W. 2005. Autism: neuropathology, alterations of the GABAergic system, and animal models. Int. Rev. Neurobiol. 71:1–26 - PubMed
    1. Meyer U., Engler A., Weber L., Schedlowski M., Feldon J. 2008. Preliminary evidence for a modulation of fetal dopaminergic development by maternal immune activation during pregnancy. Neuroscience 154:701–709 - PubMed
    1. Shi L., Smith S. E., Malkova N., Tse D., Su Y., Patterson P. H. 2009. Activation of the maternal immune system alters cerebellar development in the offspring. Brain Behav. Immun. 23:116–123 - PMC - PubMed

Publication types

MeSH terms