. 2010 Sep 30;6(9):e1001125.
doi: 10.1371/journal.ppat.1001125.

Molecular and evolutionary bases of within-patient genotypic and phenotypic diversity in Escherichia coli extraintestinal infections

Affiliations

Molecular and evolutionary bases of within-patient genotypic and phenotypic diversity in Escherichia coli extraintestinal infections

Maxime Levert et al. PLoS Pathog. .

Erratum in

  • PLoS Pathog. 2011 Jun;7(6). doi:10.1371/annotation/700dcb3b-3475-49a1-9064-d9d070cda7be. Cruvellier, Stéphane[corrected to Cruveiller, Stéphane]

Abstract

Although polymicrobial infections, caused by combinations of viruses, bacteria, fungi and parasites, are being recognised with increasing frequency, little is known about the occurrence of within-species diversity in bacterial infections and the molecular and evolutionary bases of this diversity. We used multiple approaches to study the genomic and phenotypic diversity among 226 Escherichia coli isolates from deep and closed visceral infections occurring in 19 patients. We observed genomic variability among isolates from the same site within 11 patients. This diversity was of two types, as patients were infected either by several distinct E. coli clones (4 patients) or by members of a single clone that exhibit micro-heterogeneity (11 patients); both types of diversity were present in 4 patients. A surprisingly wide continuum of antibiotic resistance, outer membrane permeability, growth rate, stress resistance, red dry and rough morphotype characteristics and virulence properties were present within the isolates of single clones in 8 of the 11 patients showing genomic micro-heterogeneity. Many of the observed phenotypic differences within clones affected the trade-off between self-preservation and nutritional competence (SPANC). We showed in 3 patients that this phenotypic variability was associated with distinct levels of RpoS in co-existing isolates. Genome mutational analysis and global proteomic comparisons in isolates from a patient revealed a star-like relationship of changes amongst clonally diverging isolates. A mathematical model demonstrated that multiple genotypes with distinct RpoS levels can co-exist as a result of the SPANC trade-off. In the cases involving infection by a single clone, we present several lines of evidence to suggest diversification during the infectious process rather than an infection by multiple isolates exhibiting a micro-heterogeneity. Our results suggest that bacteria are subject to trade-offs during an infectious process and that the observed diversity resembled results obtained in experimental evolution studies. Whatever the mechanisms leading to diversity, our results have strong medical implications in terms of the need for more extensive isolate testing before deciding on antibiotic therapies.


Conflict of interest statement

The authors have declared that no competing interests exist.

Figures

Figure 1
Figure 1. Electrophoretic patterns in agarose gel of PCR products from E. coli isolates.
Primers ERIC1 (A), ERIC1R (B) and ERIC2 (C) were used for E. coli isolates of patient 5 (lanes 1 to 7). MW, DNA ladder (New England Biolabs, Saint Quentin en Yvelines, France). The banding patterns of isolates 1 to 5 are clearly different from the banding patterns of isolates 6 and 7, whatever the primer. This corresponds to two distinct E. coli clones. Of note, isolate 3 with primer ERIC1R (B) can be distinguished from other isolates of the same clone by one band (white circle). This corresponds to a genetic micro-heterogeneity.
Figure 2
Figure 2. Pulsed-field gel electrophoresis resolving XbaI restriction fragments from E. coli isolates.
Lines 3–7, 9, 10 and 11–13, 15–19 correspond to isolates of patients 5 and 14, respectively. Line 1, MW, DNA ladder (New England Biolabs, Saint Quentin en Yvelines, France), lines 2, 8 and 14, unrelated E. coli strain used as control. Differences between closely related strains are indicated by circles. Patient 5 was infected by two different E. coli clones (lines 3–7 and 9,10). Banding patterns of lines 3–7 are closely related, with differences affecting only one or two bands, but completely different from banding patterns of lines 9 and 10, which are identical. These data are in agreement with the ERIC-PCR data (Fig. 1). The isolates of patient 14 (lines 11–13, 15–19) are closely related with seven bands being variable among all isolates.
Figure 3
Figure 3. Antibioresistance phenotypes of E. coli isolates.
(A) Dendrogram constructed from the pulsed-field gel electrophoresis patterns of 104 isolates of E. coli showing genetic micro-heterogeneity in 12 clones infecting 11 patients with the antibiotypes. The antibiotypes are indicated with the corresponding isolates as in Table S2. Ward's algorithm was used to cluster the isolates from a similarity matrix created by using the band-based Dice similarity coefficient. The stars indicate the isolates differentiated by ERIC-PCR. Patient 8 is infected by one A1 clone and one A0 clone. Abbreviation of the antibiotypes is as follow: A, susceptible to all antibiotics tested; B, susceptible to all antibiotics tested and hyper- susceptible to β-lactams; C, Penicillinase production; D, Penicillinase production and resistant to tetracycline (Te), minocycline (Mn), sulfonamides (Sul), streptomycin (St), kanamycin (Ka); E, resistant to Te, Mn, Ka; F, resistant to Te, Mn, Sul, St; G, Penicillinase production and resistant to Te, Mn, Ka; H, Penicillinase production and resistant to Te, Sul, trimethoprim (TMP), St, Ka, nalidixic acid (Na), chloramphenicol (Ch); I, resistant to Te, Sul, St, Na, Ch; J, Penicillinase production and resistant to Te, Mn, Sul, TMP, St; K, Penicillinase production and resistant to Te, Mn, Ch; L, Penicillinase production and resistant to Te, Mn, Sul, St, Ch; M, resistant to Sul, St; N, resistant to Te; O, resistant to Te, Sul, St. Various level of susceptibility to penicillin antibiotics were observed among isolates of patient 17. (B) Minimum inhibitory concentration (MIC) of three β-lactams [amoxicillin (AMX), Piperacillin (PIP), Ticarcillin (TIC)] and susceptibility to SDS of the nine isolates from patient 17. The antibiotype is as in (A). Note the heterogeneous patterns of MICs and SDS susceptibility of the hyper-susceptible isolates to β-lactams, indicating the implication of various mechanisms of increased outer membrane permeability. (C) Outer membrane permeability rates for the nine isolates from patient 17, compared to the rate for E. coli K-12 strain MC4100. The permeability rate for MC4100 was 3.96, in units of optical density change at 492 nm/min/1010 bacteria.
Figure 4
Figure 4. Illustration of the phenotypic diversity observed in the E. coli isolates of patient 3 infected by a unique clone [isolates from blood (ID 42–50) and liver abscess (ID 51–58)].
(A) Variability in the antibiotypes with a plasmid loss in isolate 51 responsible for the susceptible phenotype. AMX: amoxicillin, Sul: sulfonamide, St: streptomycin, Te: tetracycline. (B) Growth curves in Luria Bertani broth at 37°C of 8 isolates, showing impaired growth of isolates 45, 52 and 58. (C) Carbon source utilisation using Biolog GN2 plates that test 95 substrates. Only substrates differentially used by the isolates are indicated. The substrates are as follows. a: Dextrin, b: Bromosuccinic Acid, c: Glucuronamide, d: L-Alanine, e: L-Asparagine, f: L-Aspartic Acid, g: Glycyl-L-Aspartic Acid, h: L-Serine, i: D,L-α-Glycerol Phosphate. Substrates with a star correspond to substrates whose metabolism is stimulated by an rpoS disruption . Black and white squares indicate the use or the absence of use of the substrate, respectively. (D) Non motile (52) and motile (54) isolates in 0.35% agar plates incubated for 48 hours at 37°C in humid atmosphere. (E) Sensitivity to H2O2 measured by the survival in % at different times. The greatest differences were observed at 5 minutes. The colour code for the isolates is as in (B). (F) Kaplan-Meier curves estimating the survival function of mice subcutaneously inoculated by 2×10⁸ colony forming units of the different isolates. Only one curve of each statistically significant category is presented. Isolates range from the more to the less virulent as follow: isolates 54 and 50 (group 4), isolates 42, 47 and 51 (group 3), isolates 52 and 58 (group 2) and isolate 45 (group 1).
Figure 5
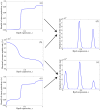
Figure 5. Level of RpoS in 8 representative E. coli isolates of patient 3.
The level of RpoS was assessed by rdar morphotypes (A), staining glycogen with iodine solution (B) and RpoS immunoblot (C). RpoS amount is expressed as the ratio of the RpoS band to a constant cross-reactive band. The negative control (E. coli MG1655 ΔrpoS strain) is on the right part of the figure. Experiments in B and C were repeated 2 times, given values are the mean of the two experiments.
Figure 6
Figure 6. Statistically significant links between phenotypes and the 27 differentially expressed proteins of the 8 representative E. coli isolates of patient 3.
The links depicted by a line, in green when positive (phenotypes and/or amounts of protein increase together) or in red when negative (a phenotype or an amount of protein increases when the other increases). Lighter is the line, more significant is the link. Only one protein (putative outer membrane protein) is not linked. Note that the links presented here are coherent with those of the phenotypes from the data set corresponding to 23 isolates originating from 8 patients (Fig. S1).
Figure 7
Figure 7. Neighbour joining distance tree based on the phenotypic and proteomic data indicating the relationships between the 8 representative E. coli isolates of patient 3 with the identified mutations.
Bootstrap values in percentages are calculated from 10,000 replicates. The boxed isolates correspond to the isolates fully sequenced. The isolate with a star (51) is a mutator isolate. The identified mutations (Table 4) as well as the plasmid loss are indicated in boxes at each isolate.
Figure 8
Figure 8. Model of the distinct levels of RpoS.
(d) Long-term population structure supporting two genotypes with distinct levels of RpoS, requires the benefit of stress protection and maximal rate of resource uptake to have the form illustrated in (a) and (b) respectively. (e) Long-term population structure supporting three genotypes with distinct levels of RpoS, requires the benefit of stress protection and maximal rate of resource uptake to have the form illustrated in (c) and (b) respectively. Here ε = 0.325×10⁻⁸, S0  =  1.1×10⁹ picomoles of sugar, D = 0.0017 per minute, k = 4×10⁶ picomoles of sugar and r = 237 cells per picomole of sugar. The maximal uptake rate f(x) is measured in picomoles of sugar per cell per minute.

Similar articles

Cited by

References

    1. Brogden KA, Guthmiller JM, Taylor CE. Human polymicrobial infections. Lancet. 2005;365:253–255. - PMC - PubMed
    1. Denamur E, Picard B, Goullet P, Bingen E, Lambert N, et al. Complexity of Pseudomonas aeruginosa infection in cystic fibrosis: combined results from esterase electrophoresis and rDNA restriction fragment length polymorphism analysis. Epidemiol Infect. 1991;106:531–539. - PMC - PubMed
    1. Romling U, Fiedler B, Bosshammer J, Grothues D, Greipel J, et al. Epidemiology of chronic Pseudomonas aeruginosa infections in cystic fibrosis. J Infect Dis. 1994;170:1616–1621. - PubMed
    1. Pirnay JP, De Vos D, Cochez C, Bilocq F, Pirson J, et al. Molecular epidemiology of Pseudomonas aeruginosa colonization in a burn unit: persistence of a multidrug-resistant clone and a silver sulfadiazine-resistant clone. J Clin Microbiol. 2003;41:1192–1202. - PMC - PubMed
    1. Israel DA, Salama N, Krishna U, Rieger UM, Atherton JC, et al. Helicobacter pylori genetic diversity within the gastric niche of a single human host. Proc Natl Acad Sci U S A. 2001;98:14625–14630. - PMC - PubMed

Publication types

MeSH terms